Impossible Execution Plan Timings

This article was originally published on 𝕏.
Erik Darling (@erikdarlingdata) shared an interesting SQL Server execution plan with me recently. The demo script is at the end of this article.
The important section is shown below:

The Gather Streams operator appears to execute for less time (2.16s) than the Sort operator below it (5.431s). This seems impossible on the face of it.
The Parallelism (Gather Streams) operator runs in row mode (as always), while the Sort and Hash Match (Inner Join) operators both run in batch mode. This mixed mode plan adds a little complexity to interpreting plan timings because:
- A batch mode operator reports CPU and elapsed times for that operator alone
- A row mode operator reports times for itself and all its children
I’ve written about those aspects before in Understanding Execution Plan Operator Timings, which also covers a confusing situation that can arise in exclusively row mode parallel plans.
I showed a hidden option to make all operators report only their individual times in More Consistent Execution Plan Timings in SQL Server 2022. That feature isn’t complete yet, so the results aren’t perfect, and it’s not documented or supported.
I mention all that in case you are interested in the background. None of the foregoing explains what we see in this mixed mode plan. The row mode Gather Streams elapsed time ought to include its children. The batch mode Sort should just be reporting its own elapsed time.
With that understanding in mind, there’s no way the Sort could run for longer than the Gather Streams. What’s going on here?
The Gather Streams
You’re probably used to seeing a Gather Streams operator at the root of an execution plan reporting an elapsed time very close to the entire statement run time. This makes sense in general because its elapsed time includes itself and its subtree, which is the whole of the rest of the plan.
That’s not quite the full story here because the Gather Streams is not at the root of the plan. There is another icon to its immediate left—the SELECT. This SELECT icon includes the following timing information:

Missing time
Ok, so the Gather Streams (including its children) ran for 2.16s and the query as a whole ran for 7.509s. Where did the rest of the time go?
We can find the answer to that in the wait stats reported in the properties of the SELECT root node. The third highest wait is:
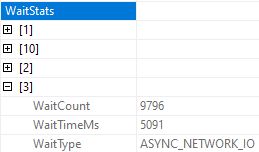
Here we see 5.091s of waiting on ASYNC_NETWORK_IO. This represents time spent waiting for the client to consume the results we’re sending.
In this case, the client is SSMS running on the local machine over a shared memory connection so there’s no ‘network’ delay as such. Instead, the delay arises because the query produces 1,189,243 rows of output for display in the SSMS display grid—a notoriously slow component.
Query result rows are packaged up into buffers to send to the client at the root of the query plan. When a slow client causes the output buffers to fill up, SQL Server waits on ASYNC_NETWORK_IO.
This wait occurs above the Gather Streams operator, so the delays are not included in its timings.
That explains one part of the mystery. The second question is why a parallel batch mode Sort of just over a million rows takes 5.431s. That seems like an awfully long time.
The Parallel Batch Mode Sort
The parallel batch mode Sort runs on additional worker threads, which are not blocked when the parent task running the consumer side of the Gather Streams exchange becomes blocked at the root of the plan on ASYNC_NETWORK_IO. That’s the first thing.
Second, you might already know that a parallel batch mode sort produces its output on a single thread. We can confirm this in the Sort operator’s plan properties:
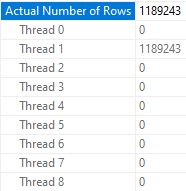
To address a common misapprehension, the sorting work itself is efficiently shared among multiple threads—it’s just that the sorted rows are output on a single thread (except when the parent operator is a Window Aggregate, which has special support for preserving global order among threads). This is a product limitation that might be addressed one day.
Let’s look at the CPU and elapsed times reported for the Sort:
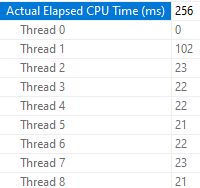
All threads took part in the sorting operation. Thread 1 uses more CPU because it was solely responsible for producing output batches.
Note that the total CPU time across all threads was only 256ms. This is not a demanding sort. No way it should take over five seconds.
Let’s look at the Sort operator’s per-thread elapsed times now:
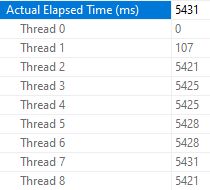
These times are much more interesting. The thread that produced all the output shows 107ms total, while all other threads are over 5420ms! 🤪
Batch Mode Sort Thread Waits
When the sorting effort is complete, a batch mode Sort chooses one thread to return batches of sorted rows to its parent operator—the producer side of the Gather Streams operator in the present case.
The other threads all wait at the Sort operator on BPSORT until the output is complete. The crucial aspect here is that the wait occurs at the Sort, so the waiting time contributes to its elapsed time.
Thread 1 has almost no waiting time at the Sort because it is busy sending batches up to the producer side of the Gather Streams exchange. It does get blocked quite often, but for a different reason.
Remember the slow SSMS client causing the parent task to wait at the root of the plan on ASYNC_NETWORK_IO? While waiting, it can’t be reading rows from the consumer side of the Gather Streams operator.
Meanwhile, the single Sort output thread continues to run, feeding rows into row packet buffers inside the Gather Streams exchange. The limited number of buffers quickly fill up because they’re not being emptied quickly enough by the parent task, so the parallel thread has to wait.
We can see these CXPACKET waits at the root of the plan:
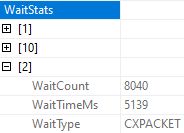
The additional parallel worker thread carrying sorted rows has to wait about as long as the other Sort threads, but it waits in a different place—at the producer side of the exchange. These CXPACKET waits don’t occur at the Sort, so the Sort operator’s thread 1 elapsed times there don’t include it.
The elapsed time reported for the parallel batch mode Sort operator is the maximum of the individual thread elapsed times (5431ms). That comes from a thread doing nothing except waiting for thread 1 to complete its output duties!
You might think this reporting arrangement is unhelpful and misleading, given what’s really going on under the covers, but that’s how it works today.
Execution plans also don’t provide separate elapsed times for the consumer and producer sides of an exchange, so we can’t see the producer-side CXPACKET delays directly. This is something I have already complained about in the previously linked articles.
Now we know why the timings look like they do, what can we do about it?
Workarounds
The root cause is the slow consumption of rows by SSMS. Everything else is a consequence of buffers filling up so waits occur in different parts of the plan. The way metrics are recorded makes it difficult to see what’s going on.
Anything that relieves the ASYNC_NETWORK_IO bottleneck at the root of the plan will free things up.
1. Temporary table
One obvious solution is to write the output to a temporary table (not a table variable, because that would disable parallelism for the whole plan).
We’ll need a clustered index in the same order as the Sort output to preserve that plan operator. An identity column on the target table would also serve the purpose, given there is an ORDER BY clause on the SELECT to determine the identity assignment order.

The parallel batch mode Sort now completes in 634ms and execution as a whole is done in 2,748ms (down from 7,509ms).
We would still need to return rows from the temporary table to SSMS, but there’s not much to be done about that. At least the memory and threads used by the main plan will have been released by then.
2. Eager spool
If you can’t use a temporary table, or multiple statements in general, one creative workaround is to engineer an Eager Table Spool at the top of the plan using a form of TOP (100) PERCENT that the optimizer can’t simplify away. For example, TOP (@@SPID - @@SPID + 100) PERCENT:

This works in a similar way to the temporary table. It allows the parent task to read from the consumer side of the Gather Streams exchange and write to the Eager Spool without any ASYNC_NETWORK_IO waits caused by a slow client.
It’s a little slower because spools (embarrassingly) aren’t as optimised for writing as temporary tables (no bulk load). The consumer side can’t keep up with the producer, so we do see some CXPACKET waits. Still, the timings appear more natural.
3. Reduce parallelism
Reducing the degree of parallelism (DOP) for the whole query might help by slowing the rate at which the Sort can produce rows. Remember, all threads contribute to every stage of a parallel batch mode Sort, it’s just that the output batches appear on a single thread.
The downside of this idea is it reduces parallelism for the whole plan. Other operations might benefit from a higher DOP.
Running the demo query at MAXDOP 2 produces ‘sensible’ timings where the Gather Streams runs for longer than the Sort:

4. Row mode sort
We can use trace flag 9347 to disable batch mode sorts, while allowing other operators to continue to run in batch mode.
A parallel row mode Sort operator produces sorted output across all parallel threads. There are no long BPSORT waits at the Sort while one thread sends the output as we saw for a parallel batch mode Sort.
A slow client will still result in delays at the exchange, but the parallel waits will all be CXPACKET at the producer side of the exchange, so elapsed times will appear consistent:

Don’t be misled by the Gather Streams elapsed time of 2.385s. This DOP 8 plan runs for 7.65s due to the ASYNC_NETWORK_IO waits at the root.
Summary & final thoughts
In this example, a hidden delay was exposed in ASYNC_NETWORK_IO waits on the root node. That explained why the Gather Streams operator apparently undercounted elapsed time.
A parallel batch mode Sort has the curious behaviour of emitting all its sorted rows on a single thread. Other threads wait at the Sort on the generic BPSORT wait until the output is fully consumed by parent operators. One could debate the merits of this arrangement and whether it really represents time taken by the Sort.
A parallel row mode sort emits sorted output across all its threads, with synchronization and partitioning happening at exchanges (Parallelism operators). Waits unrelated to sorting activity occur, and are counted, at the exchange rather than the row mode Sort operator itself.
Parallel plans can be difficult to interpret correctly. You may need to check detailed root node properties to understand why timings look strange. You may also need to know a fair bit about how row mode and batch mode parallelism are implemented to really understand what’s going on and what you might need to do to improve things.
Thanks for reading.
Appendix: Demo
If you want to try these queries for yourself, you’ll need the Stack Overflow 2013 database with the following index:
CREATE INDEX p
ON dbo.Posts
    (OwnerUserId, Score DESC, CreationDate)
INCLUDE
    (PostTypeId)
WITH
    (SORT_IN_TEMPDB = ON, DATA_COMPRESSION = PAGE);
Erik’s demo query with my various workaround options in comments:
/*
-- Uncomment to write to the temporary table
DROP TABLE IF EXISTS #Results;

CREATE TABLE #Results
(
    Id integer NOT NULL,
    Reputation integer NOT NULL,
    DisplayName nvarchar(40) COLLATE DATABASE_DEFAULT NOT NULL,
    AvgScore integer NOT NULL,
    INDEX c CLUSTERED (AvgScore DESC)
);

INSERT #Results
*/
SELECT
    /*
    -- Uncomment for the Eager Spool workaround
    --TOP (@@SPID - @@SPID + 100) PERCENT
    */
    U.Id,
    U.Reputation,
    U.DisplayName,
    PA.AvgScore
FROM dbo.Users AS U
JOIN
(
    SELECT
        P.OwnerUserId,
        P.PostTypeId,
        AvgScore = AVG(P.Score)
    FROM dbo.Posts AS P
    WHERE
        P.PostTypeId IN (1, 2)
        AND EXISTS
        (
            SELECT *
            FROM dbo.Votes AS V
            WHERE
                V.PostId  = P.Id
                AND V.VoteTypeId IN (2, 3)
        )
    GROUP BY
        P.OwnerUserId,
        P.PostTypeId
) AS PA
    ON PA.OwnerUserId = U.Id
WHERE
    PA.AvgScore > 0
ORDER BY
    PA.AvgScore DESC
OPTION
(
    /*
    -- Uncomment to disallow batch mode sort only
    QUERYTRACEON 9347,
    */
    USE HINT
    (
        'QUERY_OPTIMIZER_COMPATIBILITY_LEVEL_160',
        -- These add no value here
        'DISABLE_BATCH_MODE_ADAPTIVE_JOINS'
    ),
    -- Adjust parallelism
    MAXDOP 8
);