Understanding Execution Plan Operator Timings

Introduction
SQL Server 2014 SP2 and later produce runtime (“actual”) execution plans that can include elapsed time and CPU usage for each execution plan operator (see KB3170113 and this blog post by Pedro Lopes).
Interpreting these numbers is not always as straightforward as one might expect. There are important differences between row mode and batch mode execution, as well as tricky issues with row mode parallelism. SQL Server makes some timing adjustments in parallel plans to promote consistency, but they are not perfectly implemented. This can make it difficult to draw sound performance-tuning conclusions.
This article aims to help you understand where the timings come from in each case, and how they can best be interpreted in context.
Setup
The following examples use the public Stack Overflow 2013 database (download details), with a single index added:
CREATE INDEX PP
ON dbo.Posts (PostTypeId ASC, CreationDate ASC)
INCLUDE (AcceptedAnswerId);
The test queries return the number of questions with an accepted answer, grouped by month and year. They are run on SQL Server 2019 CU9, on a laptop with 8 cores, and 16GB of memory allocated to the SQL Server 2019 instance. Compatibility level 150 is used exclusively.
Batch Mode Serial Execution
SELECT
    CA.TheYear,
    CA.TheMonth,
    AcceptedAnswers = COUNT_BIG(*)
FROM dbo.Posts AS Q
JOIN dbo.Posts AS A
    ON A.Id = Q.AcceptedAnswerId
CROSS APPLY
(
    VALUES
    (
        YEAR(Q.CreationDate),
        MONTH (Q.CreationDate)
    )
) AS CA (TheYear, TheMonth)
WHERE
    Q.PostTypeId = 1
    AND A.PostTypeId = 2
GROUP BY
    CA.TheYear, CA.TheMonth
ORDER BY
    CA.TheYear, CA.TheMonth
OPTION
(
    MAXDOP 1,
    USE HINT ('DISABLE_BATCH_MODE_ADAPTIVE_JOINS')
);
The execution plan is:

Every operator in this plan runs in batch mode, thanks to the batch mode on rowstore Intelligent Query Processing feature in SQL Server 2019 (no columnstore index needed). The query runs for 2,523ms with 2,522ms CPU time used, when all data needed is already in the buffer pool.
As Pedro Lopes notes in the blog post linked earlier, the elapsed and CPU times reported for individual batch mode operators represent the time used by that operator alone.
SSMS displays elapsed time in the graphical representation. To see the CPU times, select a plan operator, then look in the Properties window. This detailed view shows both elapsed and CPU time, per operator, and per thread.
The showplan times (including the XML representation) are truncated to milliseconds. If you need greater precision, use the query_thread_profile extended event, which reports in microseconds. The output from this event for the execution plan shown above is:

This shows elapsed time for the join (node 2) is 701,465µs (truncated to 701ms in showplan). The aggregate has an elapsed time of 62,162µs (62ms). The ‘questions’ index seek is displayed as running for 385ms, while the extended event shows the true figure for node 4 was 385,938µs (very nearly 386ms).
SQL Server uses the high-precision QueryPerformanceCounter API to capture timing data. This uses hardware, typically a crystal oscillator, that produces ticks at a very high constant rate regardless of processor speed, power settings, or anything of that nature. The clock keeps running at the same rate even during sleep. See the linked very detailed article if you are interested in all of the finer detail. The short summary is you can trust the microsecond numbers to be accurate.
In this pure batch mode plan, total execution time is very close to the sum of the individual operator elapsed times. The difference is largely down to post-statement work not associated with plan operators (which have all closed down by then), though the millisecond truncation also plays a part.
In pure batch mode plans, you need to manually sum current and child operator times to obtain the cumulative elapsed time at any given node.
Batch Mode Parallel Execution
SELECT
    CA.TheYear,
    CA.TheMonth,
    AcceptedAnswers = COUNT_BIG(*)
FROM dbo.Posts AS Q
JOIN dbo.Posts AS A
    ON A.Id = Q.AcceptedAnswerId
CROSS APPLY
(
    VALUES
    (
        YEAR(Q.CreationDate),
        MONTH (Q.CreationDate)
    )
) AS CA (TheYear, TheMonth)
WHERE
    Q.PostTypeId = 1
    AND A.PostTypeId = 2
GROUP BY
    CA.TheYear, CA.TheMonth
ORDER BY
    CA.TheYear, CA.TheMonth
OPTION
(
    MAXDOP 8,
    USE HINT ('DISABLE_BATCH_MODE_ADAPTIVE_JOINS')
);
The execution plan is:

Every operator except the final gather stream exchange runs in batch mode. Total elapsed time is 933ms with 6,673ms of CPU time with a warm cache.
Selecting the hash join and looking in the SSMS Properties window, we see elapsed and CPU time per thread for that operator:
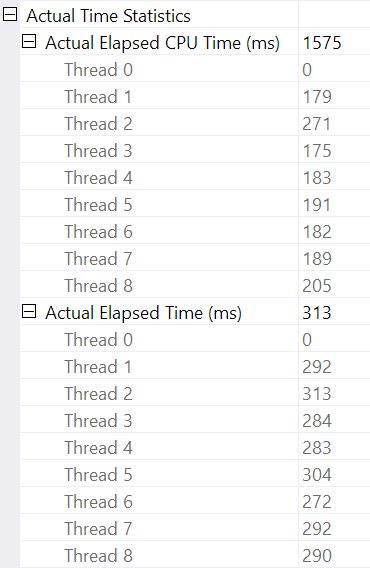
The CPU time reported for the operator is the sum of the individual thread CPU times. The reported operator elapsed time is the maximum of the per-thread elapsed times. Both calculations are performed over the per-thread truncated millisecond values. As before, total execution time is very close the the sum of individual operator elapsed times.
Batch mode parallel plans do not use exchanges to distribute work among threads. Batch operators are implemented so that multiple threads can work efficiently on a single shared structure (e.g. hash table). Some synchronization among threads is still required in batch mode parallel plans, but sync points and other details are not visible in showplan output.
Row Mode Serial Execution
SELECT
    CA.TheYear,
    CA.TheMonth,
    AcceptedAnswers = COUNT_BIG(*)
FROM dbo.Posts AS Q
JOIN dbo.Posts AS A
    ON A.Id = Q.AcceptedAnswerId
CROSS APPLY
(
    VALUES
    (
        YEAR(Q.CreationDate),
        MONTH (Q.CreationDate)
    )
) AS CA (TheYear, TheMonth)
WHERE
    Q.PostTypeId = 1
    AND A.PostTypeId = 2
GROUP BY
    CA.TheYear, CA.TheMonth
ORDER BY
    CA.TheYear, CA.TheMonth
OPTION
(
    MAXDOP 1,
    USE HINT ('DISALLOW_BATCH_MODE')
);
The execution plan is visually the same as the batch mode serial plan, but every operator is now running in row mode:

The query runs for 9,850ms with 9,845ms CPU time. This is a lot slower than the serial batch mode query (2523ms/2522ms), as expected. More importantly for the present discussion, the row mode operator elapsed and CPU times represent the time used by the current operator and all its children.
The extended event also shows cumulative CPU and elapsed times at each node (in microseconds):

There is no data for the compute scalar operator (node 3) because row mode execution can defer most expression computations to the operator that consumes the result. This is currently not implemented for batch mode execution.
The reported cumulative elapsed time for row mode operators means the time shown for the final sort operator closely matches the total execution time for the query (to millisecond resolution anyway). The elapsed time for the hash join likewise includes contributions from the two index seeks below it, as well as its own time. To calculate the elapsed time for the row mode hash join alone, we would need to subtract both seek times from it.
There are advantages and disadvantages to both presentations (cumulative for row mode, individual operator only for batch mode). Whichever you prefer, it is important to be aware of the differences.
Mixed execution mode plans
In general, modern execution plans may contain any mixture of row mode and batch mode operators. The batch mode operators will report times just for themselves. The row mode operators will include a cumulative total up to that point in the plan, including all child operators. To be clear about it: a row mode operator’s cumulative times include any batch mode child operators.
We saw this previously in the parallel batch mode plan: The final (row mode) gather streams operator had a displayed (cumulative) elapsed time of 0.933s—including all its child batch mode operators. The other operators were all batch mode, and so reported times for the individual operator alone.
This situation, where some plan operators in the same plan have cumulative times and others not, will no doubt be regarded as confusing by many people.
Row Mode Parallel Execution
SELECT
    CA.TheYear,
    CA.TheMonth,
    AcceptedAnswers = COUNT_BIG(*)
FROM dbo.Posts AS Q
JOIN dbo.Posts AS A
    ON A.Id = Q.AcceptedAnswerId
CROSS APPLY
(
    VALUES
    (
        YEAR(Q.CreationDate),
        MONTH (Q.CreationDate)
    )
) AS CA (TheYear, TheMonth)
WHERE
    Q.PostTypeId = 1
    AND A.PostTypeId = 2
GROUP BY
    CA.TheYear, CA.TheMonth
ORDER BY
    CA.TheYear, CA.TheMonth
OPTION
(
    MAXDOP 8,
    USE HINT ('DISALLOW_BATCH_MODE')
);
The execution plan is:

Every operator is row mode. The query runs for 4,677ms with 23,311ms CPU time (sum of all threads).
As an exclusively row mode plan, we would expect all times to be cumulative. Moving from child to parent (right to left), times ought to increase in that direction.
Let’s look at just the rightmost section of the plan:

Working right to left on the top row, cumulative times certainly seem to be the case. But there is an exception on the lower input to the hash join: The index seek has an elapsed time of 1.467s, while its parent repartition streams has an elapsed time of only 0.517s.
How can a parent operator run for less time than its child if elapsed times are cumulative in row mode plans?
Inconsistent times
There are several parts to the answer to this puzzle. Let’s take it piece by piece, because it is quite complex:
First, recall that an exchange (parallelism operator) has two parts. The left hand (consumer) side is connected to one set of threads running operators in the parallel branch to the left. The right hand (producer) side of the exchange is connected to a different set of threads running operators in the parallel branch to the right.
Rows from the producer side are assembled into packets and then transferred to the consumer side. This provides a degree of buffering and flow control between the two sets of connected threads. (If you need a refresher on exchanges and parallel plan branches, please see my article Parallel Execution Plans—Branches and Threads.)
The scope of cumulative times
Looking at the parallel branch on the producer side of the exchange:
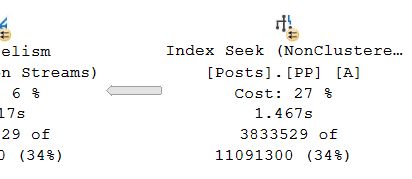
As usual, DOP (degree of parallelism) additional worker threads run an independent serial copy of the plan operators in this branch. So, at DOP 8, there are 8 independent serial index seeks co-operating to perform the range-scan part of the overall (parallel) index seek operation. Each single-threaded seek is connected to a different input (port) on the producer side of the single shared exchange operator.
A similar situation exists on the consumer side of the exchange. At DOP 8, there are 8 separate single-threaded copies of this branch all running independently:

Each of these single-threaded subplans run in the usual way, with each operator accumulating elapsed and CPU time totals at each node. Being row mode operators, each total represents time spent the cumulative total for the current node and each of its children.
The crucial point is that the cumulative totals only include operators on the same thread and only within the current branch. Hopefully, this makes intuitive sense, because each thread has no idea what might be going on elsewhere.
How row mode metrics are collected
The second part of the puzzle relates to the way row count and timing metrics are collected in row mode plans. When runtime (“actual”) plan information is required, the execution engine adds an invisible profiling operator to the immediate left (parent) of every operator in the plan that will be executed at runtime.
This operator may record (among other things) the difference between the time at which it passed control to its child operator, and the time when control was returned. This time difference represents the elapsed time for the monitored operator and all its children, since the child calls into its own child per row and so on. An operator may be called many times (to initialize, then once per row, finally to close) so the time collected by the profiling operator is an accumulation over potentially many per-row iterations.
For more details on the profiling data collected using different capture methods, see the product documentation covering the Query Profiling Infrastructure. For those interested in such things, the name of the invisible profiling operator used by the standard infrastructure is sqlmin!CQScanProfileNew. Like all row mode iterators, it has Open, GetRow, and Close methods, among others. Each method contains calls to the Windows QueryPerformanceCounter API to collect the current high resolution timer value.
Since the profiling operator is to the left of the target operator, it measures only the consumer side of the exchange. There is no profiling operator for the producer side of the exchange (sadly). If there were, it would match or exceed the elapsed time shown on the index seek, because the index seek and producer side are running the same set of threads and the producer side of the exchange is the parent operator of the index seek.
Timing revisited

With all that said, you may still have trouble with the timings shown above. How can an index seek take 1.467s to pass rows into the producer side of an exchange, but the consumer side only take 0.517s to receive them? Regardless of separate threads, buffering, and whatnot, surely the exchange should run (end-to-end) longer than the seek does?
Well, yes it does, but that’s a different measurement from elapsed or CPU time. Let’s be precise about what we’re measuring here.
For row mode elapsed time, imagine a stopwatch per thread at each operator. The stopwatch starts when SQL Server enters the code for an operator from its parent, and stops (but does not reset) when that code leaves the operator to return control back to the parent (not to a child). Elapsed time includes any waits or scheduling delays – neither of those stop the watch.
For row mode CPU time, imagine the same stopwatch with the same characteristics, except it stops during waits and scheduling delays. It only accumulates time when the operator or one of its children is actively executing on a scheduler (CPU). The total time on a per-thread per-operator stopwatch is built up of a start-stop cycle for each row.
Let’s apply that to the current situation with the consumer side of the exchange and the index seek:
Remember, the consumer side of the exchange and index seek are in separate branches, so they’re running on separate threads. The consumer side has no children in the same thread. The index seek has the producer side of the exchange as its same-thread parent, but we don’t have a stopwatch there.
Each consumer thread starts its watch when its parent operator (the probe side of the hash join) passes control (e.g. to fetch a row). The watch keeps running while the consumer retrieves a row from the current exchange packet. The watch stops when control leaves the consumer and returns to the hash join probe side. Further parents (the partial aggregate and its parent exchange) will also work on that row (and might wait) before control returns to the consumer side of our exchange to fetch the next row. At that point, the consumer side of our exchange starts accumulating elapsed and CPU time again.
Meanwhile, independently of whatever the consumer side branch threads might be doing, the index seek threads are continuing to locate rows in the index and feed them into the exchange. An index seek thread starts its stopwatch when the producer side of the exchange asks it for a row. The stopwatch is paused when the row is passed to the exchange. When the exchange asks for the next row, the index seek stopwatch resumes.
Note that the producer side of the exchange may experience CXPACKET waits as the exchange buffers fill up, but that won’t add to the elapsed times recorded at the index seek because its stopwatch isn’t running when that happens. If we had a stopwatch for the producer side of the exchange, the missing elapsed time would show up there.
To approximate a summary of the situation visually, the following diagram shows when each operator accumulates elapsed time in the two parallel branches:
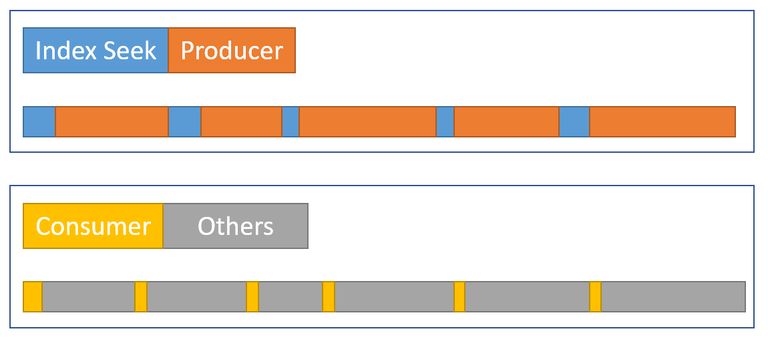
The blue index seek time bars are short because fetching a row from an index is fast. The orange producer times may be long due to CXPACKET waits. The yellow consumer times are short because it is quick to retrieve a row from the exchange when data is available. The grey time segments represent time used by the other operators (hash join probe side, partial aggregate, and its parent exchange producer side) above the consumer side of the exchange.
We expect the exchange packets to be filled quickly by the index seek, but emptied slowly (relatively speaking) by the consumer-side operators because they have more work to do. This means packets in the exchange will usually be full or close to full. The consumer will be able to retrieve a waiting row quickly, but the producer may have to wait for packet space to appear.
It is a shame we cannot see elapsed times at the producer side of the exchange. I have long been of the view that an exchange should be represented by two different operators in execution plans. It would make difficult CXPACKET/CXCONSUMER wait analysis much less necessary, and execution plans much easier to understand. The exchange producer operator would naturally get its own profiling operator.
Alternate designs
There are many ways SQL Server could achieve consistent cumulative elapsed and CPU time across parallel branches in principle. Instead of profiling operators, each row could carry information about how much elapsed and CPU time it had accrued so far on its journey through the plan. With history associated with each row, it wouldn’t matter how exchanges redistribute rows among threads and so on.
That is not how the product has been designed, so that’s not what we have (and it might be inefficient anyway). To be fair, the original row mode design was concerned only with things like collecting actual row counts and the number of iterations at each operator. Adding per-operator elapsed time to plans was a much-requested feature, but it was not easy to incorporate into the existing framework.
When batch mode processing was added to the product, a different approach (timing for the current operator only) could be implemented as part of the original development without breaking anything. Again, in principle, row mode operators could have been modified to work in the same way as batch mode operators, but that would have required a great deal of work reengineering every existing row mode operator. Adding a new data point to the existing row mode profiling operators was much easier. Given limited engineering resources, and a long list of desired product improvements, compromises like this often have to be made.
The second problem
Another cumulative timing inconsistency occurs in the present plan on the left hand side:

At first glance, this seems like the same issue: The partial aggregate has an elapsed time of 4.662s, but the exchange above it only runs for 2.844s. The same basic mechanics as before are in play of course, but there is another important factor. One clue lies in the suspiciously equal times reported for the stream aggregate, sort, and repartitioning exchange.
Remember the “timing adjustments” I mentioned in the introduction? This is where those come in. Let’s look at the individual elapsed times for threads on the consumer side of the repartition streams exchange:
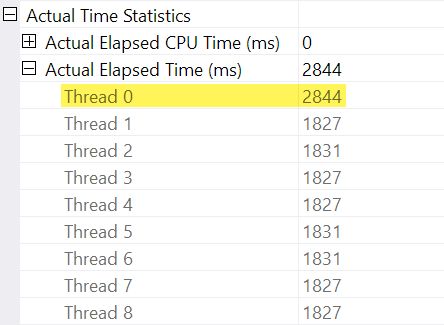
Recall that plans show the elapsed time for a parallel operator as the maximum of the per-thread times. All 8 threads had an elapsed time around 1,830ms but there is an additional entry for “Thread 0” with 2,844ms. Indeed every operator in this parallel branch (the exchange consumer, the sort, and the stream aggregate) have the same 2,844ms contribution from “Thread 0”.
Thread zero (aka parent task or coordinator) only directly runs operators to the left of the final gather streams operator. Why is there work assigned to it here, in a parallel branch?
Explanation
This issue may occur when there is a blocking operator in the parallel branch below (to the right of) the current one. Without this adjustment, operators in the current branch would under-report elapsed time by the amount of time needed to open the child branch (there are complicated architectural reasons for this).
SQL Server looks to account for this by recording the child branch delay at the exchange in the invisible profiling operator. The time value is recorded against the parent task (“Thread 0”) in the difference between its first active and last active times. (It might seem odd to record the number in this way, but at the time the number needs to be recorded, the additional parallel worker threads haven’t been created yet).
In the current case, the 2,844ms adjustment predominantly arises due to the time it takes the hash join to build its hash table. (Note this time is different from the total execution time of the hash join, which includes the time taken to process the probe side of the join).
The need for an adjustment arises because a hash join is blocking on its build input. (Interestingly, the hash partial aggregate in the plan is not considered blocking in this context because it is only assigned a minimal amount of memory, never spills to tempdb, and simply stops aggregating if it runs out of memory (thereby returning to a streaming mode). Craig Freedman explains this in his post, Partial Aggregation).
Given that the elapsed time adjustment represents an initialization delay in the child branch, SQL Server ought to treat the “Thread 0” value as an offset for the measured per-thread elapsed time numbers within the current branch. Taking the maximum of all threads as the elapsed time is reasonable in general, because threads tend to start at the same time. It does not make sense to do this when one of the thread values is an offset for all the other values!
We can do the correct offset calculation manually using the data available in the plan. At the consumer side of the exchange we have:

The maximum elapsed time among the additional worker threads is 1,831ms (excluding the offset value stored in “Thread 0”). Adding the offset of 2,844ms gives a total of 4,675ms.
In any plan where the per-thread times are less than the offset, the operator will incorrectly show the offset as the total elapsed time. This is likely to occur when the earlier blocking operator is slow (perhaps a sort or global aggregate over a large set of data) and the later branch operators are less time-consuming.
Revisiting this part of the plan:

Replacing the 2,844ms offset erroneously assigned to the repartition streams, sort, and stream aggregate operators with our calculated 4,675ms value puts their cumulative elapsed times neatly between the 4,662ms at the partial aggregate and the 4,676ms at the final gather streams. (The sort and aggregate operate on a tiny number of rows so their elapsed time calculations come out the same as the sort, but in general they would often be different):

All operators in the plan fragment above have 0ms of elapsed CPU time across all threads (aside from the partial aggregate, which has 14,891ms). The plan with our computed numbers therefore makes much more sense than the displayed one:
- 4,675ms - 4,662ms = 13ms elapsed is a much more reasonable number for the time consumed by the repartition streams alone. This operator consumes no CPU time, and only processes 524 rows.
- 0ms elapsed (to millisecond resolution) is reasonable for the tiny sort and stream aggregate (again, excluding their children).
- 4,676ms - 4,675ms = 1ms seems good for the final gather streams to collect 66 rows onto the parent task thread for return to the client.
Aside from the obvious inconsistency in the given plan between the partial aggregate (4,662ms) and repartition streams (2,844ms), it is unreasonable to think the final gather streams of 66 rows could be responsible for 4,676ms - 2,844ms = 1,832ms of elapsed time. The corrected number (1ms) is much more accurate, and will not mislead query tuners.
Now, even if this offset calculation were performed correctly, parallel row mode plans might not show consistent cumulative times in all cases, for the reasons discussed previously. Achieving complete consistency might be difficult, or even impossible without major architectural changes.
To anticipate a question that might arise at this point: No, the earlier exchange and index seek analysis did not involve a “Thread 0” offset calculation error. There is no blocking operator below that exchange, so no initialization delay arises.
A Final Example
This next example query uses the same database and index as before. I won’t explore it in too much detail because it serves only to expand on points I have already made, for the interested reader.
The features of this demo are:
- Without an
ORDER GROUPhint, it shows how a partial aggregate is not considered a blocking operator, so no “Thread 0” adjustment arises at the repartition streams exchange. The elapsed times are consistent. - With the hint, blocking sorts are introduced instead of a hash partial aggregate. Two different “Thread 0” adjustments appear at the two repartitioning exchanges. Elapsed times are inconsistent on both branches, in different ways.
Query:
SELECT * FROM
(
    SELECT
        yr = YEAR(P.CreationDate),
        mth = MONTH(P.CreationDate),
        mx = MAX(P.CreationDate)
    FROM dbo.Posts AS P
    WHERE
        P.PostTypeId = 1
    GROUP BY
        YEAR(P.CreationDate),
        MONTH(P.CreationDate)
) AS C1
JOIN
(
    SELECT
        yr = YEAR(P.CreationDate),
        mth = MONTH(P.CreationDate),
        mx = MAX(P.CreationDate)
    FROM dbo.Posts AS P
    WHERE
        P.PostTypeId = 2
    GROUP BY
        YEAR(P.CreationDate),
        MONTH(P.CreationDate)
) AS C2
    ON C2.yr = C1.yr
    AND C2.mth = C1.mth
ORDER BY
    C1.yr ASC,
    C1.mth ASC
OPTION
(
    --ORDER GROUP,
    USE HINT ('DISALLOW_BATCH_MODE')
);
Execution plan without ORDER GROUP (no adjustment, consistent times):

Execution plan with ORDER GROUP (two different adjustments, inconsistent times):

Summary and Conclusions
Row mode plan operators report cumulative times inclusive of all child operators in the same thread. Batch mode operators record the time used inside that operator alone.
A single plan can include both row and batch mode operators; the row mode operators will record cumulative elapsed time, including any batch operators. Correctly interpreting elapsed times in mixed-mode plans can be challenging.
For parallel plans, total CPU time for an operator is the sum of individual thread contributions. Total elapsed time is the maximum of the per-thread numbers.
Row mode actual plans include an invisible profiling operator to the immediate left (parent) of executing visible operators to collect runtime statistics like total row count, number of iterations, and timings. Because the row mode profiling operator is a parent of the target operator, it captures activity for that operator and all children (but only in the same thread).
Exchanges are row mode operators. There is no separate hidden profiling operator for the producer side, so exchanges only show details and timings for the consumer side. The consumer side has no children in the same thread so it reports timings for itself only.
Long elapsed times on an exchange with low CPU usage generally mean the consumer side has to wait for rows (CXCONSUMER). This is often caused by a slow producer side (with various root causes). For an example of that with a super investigation, see CXCONSUMER As a Sign of Slow Parallel Joins by Josh Darneli.
Batch mode operators do not use separate profiling operators. The batch mode operator itself contains code to record timing on every entry and exit (e.g. per batch). Passing control to a child operator counts as an exit. This is why batch mode operators record only their own activity (exclusive of their child operators).
Internal architectural details mean the way parallel row mode plans start up would cause elapsed times to be under-reported for operators in a parallel branch when a child parallel branch contains a blocking operator. An attempt is made to adjust for the timing offset caused by this, but the implementation appears to be incomplete, resulting in inconsistent and potentially misleading elapsed times. Multiple separate adjustments may be present in a single execution plan. Adjustments may accumulate when multiple branches contain blocking operators, and a single operator may combine more than one adjustment (e.g. merge join with an adjustment on each input).
Without the attempted adjustments, parallel row-mode plans would only show consistent elapsed times within a branch (i.e. between parallelism operators). This would not be ideal, but it would arguably be better than the current situation. As it is, we simply cannot trust elapsed times in parallel row-mode plans to be a true reflection of reality.
Look out for “Thread 0” elapsed times on exchanges, and the associated branch plan operators. These will sometimes show up as implausibly identical times for operators within that branch. You may need to manually add the offset to the maximum per-thread times for each affected operator to get sensible results.
The same adjustment mechanism exists for CPU times, but it appears non-functional at the moment. Unfortunately, this means you should not expect CPU times to be cumulative across branches in row mode parallel plans. This is somewhat ironic because it does make sense to sum CPU times (including the “Thread 0” value). I doubt many people rely on cumulative CPU times in execution plans though.
With any luck, these calculations will be improved in a future product update, if the required corrective work is not too onerous.
In the meantime, this all represents another reason to prefer batch mode plans when dealing with even moderately large numbers of rows. Performance will usually be improved, and the timing numbers will make more sense. Remember, SQL Server 2019 makes batch mode processing easier to achieve in practice because it does not require a columnstore index.
Thanks for reading.
