Simple Parameterization and Trivial Plans—Part 3

Series index: Part 1 | Part 2 | Part 3 | Part 4 | Part 5 | Part 6
Execution Plans
It’s more complicated than you might expect to tell from the information provided in execution plans if a SQL statement uses simple parameterization. It’s no surprise even highly experienced SQL Server users tend to get this wrong, given the often contradictory information supplied.
Let’s look at some examples using the Stack Overflow 2010 database on SQL Server 2019 CU 14, with database compatibility set to 150.
To begin, we’ll need a new nonclustered index:
CREATE INDEX [IX dbo.Users Reputation (DisplayName)]
ON dbo.Users (Reputation)
INCLUDE (DisplayName);
1. Simple parameterization applied
This first example query uses simple parameterization:
SELECT U.DisplayName
FROM dbo.Users AS U
WHERE U.Reputation = 999;
The estimated (pre-execution) plan has the following parameterization-related elements:

Notice the @1 parameter is introduced everywhere except the query text shown across the top.
The actual (post-execution) plan has:
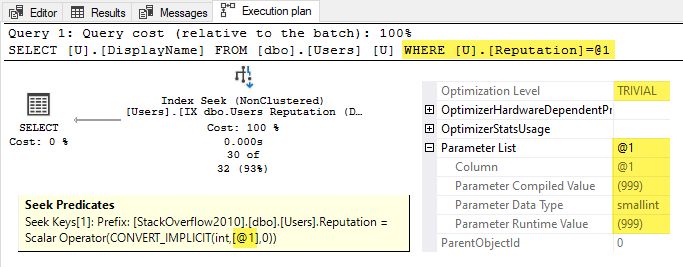
Notice the properties window has now lost the ParameterizedText element, while gaining information about the parameter runtime value. The parameterized query text is now shown across the top of the window with ‘@1’ instead of ‘999’.
2. Simple parameterization not applied
This second example does not use simple parameterization:
-- Projecting an extra column
SELECT
    U.DisplayName,
    U.CreationDate -- NEW
FROM dbo.Users AS U
WHERE
    U.Reputation = 999;
The estimated plan shows:
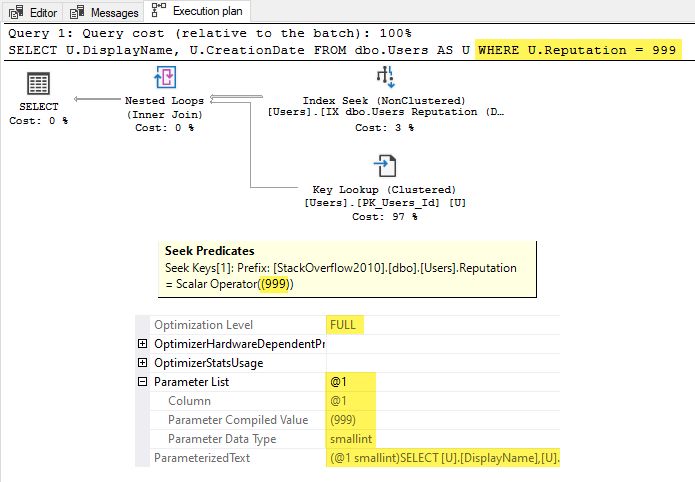
This time, the parameter @1 is missing from the Index Seek tooltip, but the parameterized text and other parameter list elements are the same as before.
Let’s look at the actual execution plan:
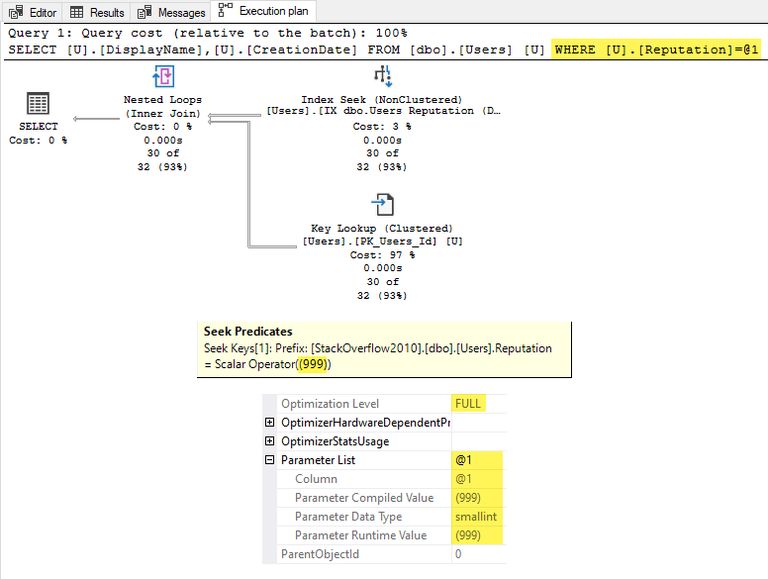
The results are the same as the previous parameterized actual plan, except now the Index Seek tooltip displays the non-parameterized value ‘999’. The query text shown across the top uses the @1 parameter marker. The properties window also uses @1 and displays the runtime value of the parameter.
The query is not a parameterized statement despite all the evidence to the contrary.
3. Parameterization not attempted
My third example is also not parameterized by the server:
-- LOWER function used
SELECT
    U.DisplayName,
    LOWER(U.DisplayName)
FROM dbo.Users AS U
WHERE
    U.Reputation = 999;
The estimated plan is:
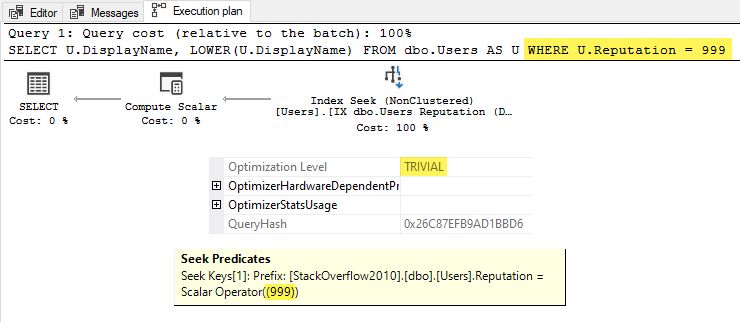
There’s no mention of a @1 parameter anywhere now, and the Parameter List section of the properties window is missing.
The actual execution plan is the same, so I won’t bother showing it.
4. Parallel parameterized plan
I want to show you one more example using parallelism in the execution plan. The low estimated cost of my test queries means we need to lower the cost threshold for parallelism to 1:
EXECUTE sys.sp_configure
    @configname = 'cost threshold for parallelism',
    @configvalue = 1;
RECONFIGURE;
The example is a bit more complex this time:
SELECT
    U.DisplayName
FROM dbo.Users AS U
WHERE
    U.Reputation >= 5
    AND U.DisplayName > N'ZZZ'
ORDER BY
    U.Reputation DESC;
The estimated execution plan is:
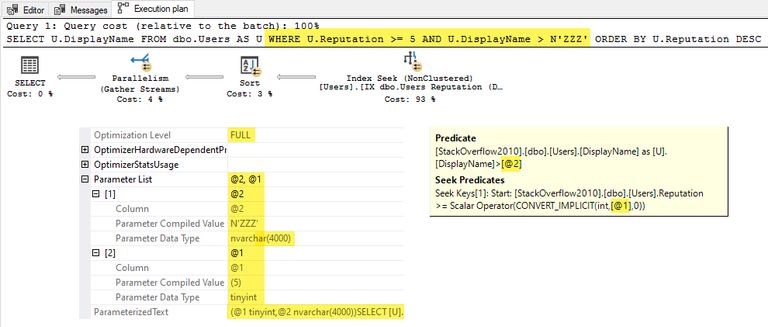
The query text across the top remains unparameterized while everything else is. There are two parameter markers now, @1 and @2, because simple parameterization found two suitable literal values.
The actual execution plan follows the pattern of example 1:
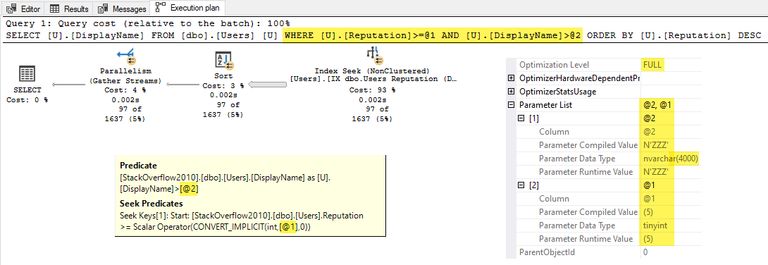
The query text across the top is now parameterized and the properties window contains runtime parameter values. This parallel plan (with a Sort operator) is definitely parameterized by the server using simple parameterization.
Reliable Methods
There are reasons for all the behaviours shown so far, and a few more besides. I’ll attempt to explain many of these in the next part of this series when I cover plan compilation.
In the meantime, the situation with showplan in general, and SSMS in particular, is less than ideal. It’s confusing for people who’ve been working with SQL Server their entire careers. Which parameter markers do you trust, and which ones do you ignore?
There are several reliable methods for determining if a particular statement had simple parameterization successfully applied to it or not.
Query store
I’ll start with one of the most convenient, the query store. Unfortunately, it’s not always as straightforward as you might imagine.
You must enable the query store feature for the database context where the statement is executed and the OPERATION_MODE must be set to READ_WRITE, allowing the query store to actively collect data.
After meeting these conditions, post-execution showplan output contains extra attributes, including the StatementParameterizationType. As the name suggests, this contains a code describing the type of parameterization used for the statement.
It’s visible in the SSMS properties window when the root node of a plan is selected:
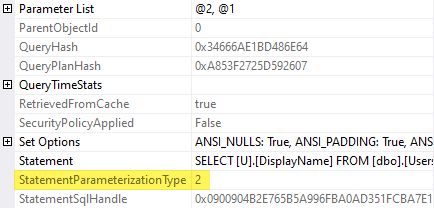
The values are documented in sys.query_store_query:
- 0 - None
- 1 - User (explicit parameterization)
- 2 - Simple parameterization
- 3 - Forced parameterization
This beneficial attribute only appears in SSMS when an actual plan is requested and missing when an estimated plan is selected. It’s important to remember the plan must be cached. Requesting an estimated plan from SSMS does not cache the plan produced (since SQL Server 2012).
Once the plan is cached, the StatementParameterizationType appears in the usual places, including via sys.dm_exec_query_plan.
You can also trust the other places parameterization type is recorded in the query store, such as the query_parameterization_type_desc column in sys.query_store_query.
One important caveat. When the query store OPERATION_MODE is set to READ_ONLY, the StatementParameterizationType attribute is still populated in SSMS actual plans—but it’s always zero—giving a false impression the statement was not parameterized when it might well have been.
If you’re happy enabling query store, are sure it’s read-write, and only look at post-execution plans in SSMS, this will work for you.
Standard plan predicates
The query text shown across the top of the graphical showplan window in SSMS isn’t reliable, as the examples have shown. Neither can you rely on the ParameterList displayed in the Properties window when the root node of the plan is selected. The ParameterizedText attribute shown for estimated plans only is also not conclusive.
You can, however, rely on the properties associated with individual plan operators. The given examples show these are present in the tooltips when hovering over an operator.
A predicate containing a parameter marker like @1 or @2 indicates a parameterized plan. The operators most likely to contain a parameter are Index Scan, Index Seek, and Filter.

If the numbering starts with @1, it uses simple parameterization. Forced parameterization begins with @0. I should mention the numbering scheme documented here is subject to change at any time:

Nevertheless, this is the method I use most often to determine if a plan was subject to server-side parameterization. It’s generally quick and easy to check a plan visually for predicates containing parameter markers. This method also works for both types of plans, estimated and actual.
Dynamic management objects
There are several ways to query the plan cache and related DMOs to determine if a statement was parameterized. Naturally, these queries only work on plans in cache, so the statement must have been executed to completion, cached, and not subsequently evicted for any reason.
The most direct approach is to look for an Adhoc plan using an exact SQL textual match to the statement of interest. The Adhoc plan will be a shell containing a ParameterizedPlanHandle if the statement is parameterized by the server. The plan handle is then used to locate the Prepared plan. An Adhoc plan will not exist if the optimize for ad hoc workloads is enabled, and the statement in question has only executed once.
This type of enquiry often ends up shredding a significant amount of XML and scanning the entire plan cache at least once. It’s also easy getting the code wrong, not least because plans in cache cover an entire batch. A batch may contain multiple statements, each of which may or may not be parameterized. Not all the DMOs work at the same granularity (batch or statement) making it quite easy to come unstuck.
An efficient way to list statements of interest, together with plan fragments for just those individual statements, is shown below:
SELECT
    StatementText =
        SUBSTRING(T.[text],
            1 + (QS.statement_start_offset / 2),
            1 + ((QS.statement_end_offset -
                QS.statement_start_offset) / 2)),
    IsParameterized =
        IIF(T.[text] LIKE N'(%',
            'Yes',
            'No'),
    query_plan =
        TRY_CONVERT(xml, P.query_plan)
FROM sys.dm_exec_query_stats AS QS
CROSS APPLY sys.dm_exec_sql_text (QS.[sql_handle]) AS T
CROSS APPLY sys.dm_exec_text_query_plan (
    QS.plan_handle,
    QS.statement_start_offset,
    QS.statement_end_offset) AS P
WHERE
    -- Statements of interest
    T.[text] LIKE N'%DisplayName%Users%'
    -- Exclude queries like this one
    AND T.[text] NOT LIKE N'%sys.dm%'
ORDER BY
    QS.last_execution_time ASC,
    QS.statement_start_offset ASC;
Examples
To illustrate, let’s run a single batch containing the four examples from earlier:
ALTER DATABASE SCOPED CONFIGURATION
    CLEAR PROCEDURE_CACHE;
GO
-- Example 1
SELECT U.DisplayName
FROM dbo.Users AS U
WHERE U.Reputation = 999;

-- Example 2
SELECT
    U.DisplayName,
    U.CreationDate
FROM dbo.Users AS U
WHERE
    U.Reputation = 999;

-- Example 3
SELECT
    U.DisplayName,
    LOWER(U.DisplayName)
FROM dbo.Users AS U
WHERE
    U.Reputation = 999;

-- Example 4
SELECT
    U.DisplayName
FROM dbo.Users AS U
WHERE
    U.Reputation >= 5
    AND U.DisplayName > N'ZZZ'
ORDER BY
    U.Reputation DESC;
GO
The output of the DMO query is:

This confirms only examples 1 and 4 were successfully parameterized.
Performance counters
It’s possible to use the SQL Statistics performance counters to get a detailed insight into parameterization activity for both estimated and actual plans. The counters used aren’t scoped per-session, so you’ll need to use a test instance with no other concurrent activity to get accurate results.
I’m going to supplement the parameterization counter information with data from the sys.dm_exec_query_optimizer_info DMO to provide statistics on trivial plans as well.
Some care is needed to prevent statements reading the counter information from modifying those counters themselves. I’m going to address this by creating a couple of temporary stored procedures:
CREATE PROCEDURE #TrivialPlans
AS
SET NOCOUNT ON;

SELECT
    OI.[counter],
    OI.occurrence
FROM sys.dm_exec_query_optimizer_info AS OI
WHERE
    OI.[counter] = N'trivial plan';
GO
CREATE PROCEDURE #PerfCounters
AS
SET NOCOUNT ON;

SELECT
    PC.[object_name],
    PC.counter_name,
    PC.cntr_value
FROM
    sys.dm_os_performance_counters AS PC
WHERE
    PC.counter_name LIKE N'%Param%';
The script to test a particular statement then looks like this:
ALTER DATABASE SCOPED CONFIGURATION
    CLEAR PROCEDURE_CACHE;
GO
EXECUTE #PerfCounters;
EXECUTE #TrivialPlans;
GO
SET SHOWPLAN_XML ON;
GO
-- The statement(s) under test:
-- Example 3
SELECT
    U.DisplayName,
    LOWER(U.DisplayName)
FROM dbo.Users AS U
WHERE
    U.Reputation = 999;
GO
SET SHOWPLAN_XML OFF;
GO
EXECUTE #TrivialPlans;
EXECUTE #PerfCounters;
Comment the SHOWPLAN_XML batches out to run the target statement(s) and get actual plans. Leave them in place for estimated execution plans.
Running the whole thing as written gives the following results:
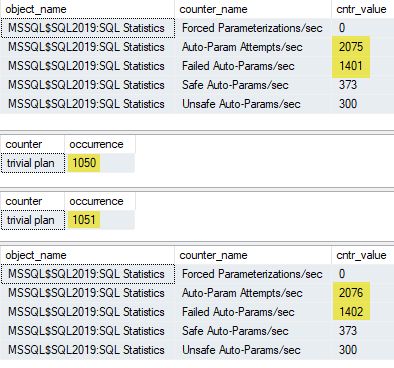
I’ve highlighted above where values changed when testing example 3.
The increase in the “trivial plan” counter from 1050 to 1051 shows a trivial plan was found for the test statement.
The simple parameterization counters increased by 1 for both attempts and failures, showing SQL Server tried to parameterize the statement, but failed.
End of Part 3
The next part of this series describes how the compilation process handles simple parameterization and trivial plans and gives the underlying reasons for some of the quirky behaviours.
If you changed your cost threshold for parallelism to run the examples, remember to reset it (mine was set to 50):
EXECUTE sys.sp_configure
    @configname = 'cost threshold for parallelism',
    @configvalue = 50;
RECONFIGURE;
Series index: Part 1 | Part 2 | Part 3 | Part 4 | Part 5 | Part 6
