Statistics on Indexed Views

Automatic statistics require a NOEXPAND hint
SQL Server can create statistics automatically to assist with cardinality estimation and cost-based decision-making during query optimization. This feature works with indexed views as well as base tables, but only if the view is explicitly named in the query and the NOEXPAND hint is specified. (There is always a statistics object associated with each index on a view, it is the automatic generation and maintenance of statistics not associated with an index that we are talking about here.)
If you are used to working with non-Enterprise editions of SQL Server, you may never have noticed this behaviour before. Lower editions of SQL Server require the NOEXPAND hint to produce a query plan that accesses an indexed view. When NOEXPAND is specified, automatic statistics are created on indexed views exactly as happens with ordinary tables.
Standard Edition with NOEXPAND
Using SQL Server 2012 Standard Edition and the AdventureWorks sample database, we first create a view that joins two sales tables and computes total order quantity per customer and product:
CREATE VIEW dbo.CustomerOrders
WITH SCHEMABINDING AS
SELECT
    SOH.CustomerID,
    SOD.ProductID,
    OrderQty = SUM(SOD.OrderQty),
    NumRows = COUNT_BIG(*)
FROM Sales.SalesOrderDetail AS SOD
JOIN Sales.SalesOrderHeader AS SOH
    ON SOH.SalesOrderID = SOD.SalesOrderID
GROUP BY
    SOH.CustomerID,
    SOD.ProductID;
For this view to support statistics, we need to materialize it by adding a unique clustered index. The combination of Customer and Product ID is guaranteed to be unique in the view (by definition) so we will use that as the key. We could specify the two columns either way round in the index, but assuming we expect more queries to filter by product, we make Product ID the leading column. This action also creates index statistics, with a histogram built from Product ID values.
CREATE UNIQUE CLUSTERED INDEX cuq
ON dbo.CustomerOrders (ProductID, CustomerID);
We are now asked to write a query that shows the total quantity of orders per customer, for a particular range of products. We expect that an execution plan using the indexed view will be an effective strategy, because it will avoid a join and operate on data that is already partially aggregated. Since we are using SQL Server Standard Edition, we must specify the view explicitly and use a NOEXPAND hint to produce a query plan that accesses the indexed view:
SELECT
    CO.CustomerID,
    SUM(CO.OrderQty)
FROM dbo.CustomerOrders AS CO WITH (NOEXPAND)
WHERE
    CO.ProductID BETWEEN 711 AND 718
GROUP BY
    CO.CustomerID;
The execution plan produced shows a seek on the indexed view to find rows for the products of interest followed by an aggregation to compute the total quantity per customer:

The Plan Tree view of Plan Explorer shows cardinality estimation is exactly correct for the indexed view seek, and very good for the result of the aggregate:
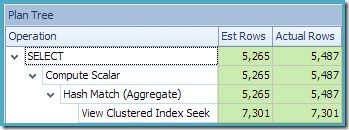
As part of the compilation and optimization process for this query, SQL Server created an additional statistics object on the Customer ID column of the indexed view. This statistic is built because the expected number and distribution of Customer IDs might be important, for example in choosing an aggregation strategy. We can see the new statistic using Management Studio Object Explorer:
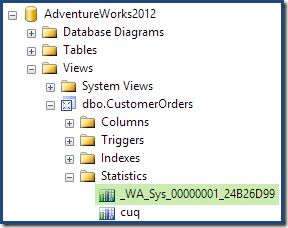
Double-clicking the statistics object confirms it was built from the Customer ID column on the view (not a base table):

Indexed Views Can Improve Estimates
Still using Standard Edition, we now drop and recreate the indexed view (which also drops the view statistics) and execute the query again, this time with the NOEXPAND hint commented out:
SELECT
    CO.CustomerID,
    SUM(CO.OrderQty)
FROM dbo.CustomerOrders AS CO --WITH (NOEXPAND)
WHERE
    CO.ProductID BETWEEN 711 AND 718
GROUP BY
    CO.CustomerID;
As expected when using Standard Edition without NOEXPAND, the resulting query plan operates on the base tables rather than the view directly:

The warning triangle on the root operator in the plan above is alerting us to a potentially useful index on the Sales Order Detail table, which is not important for our present purposes. This compilation does not create any statistics on the indexed view. The only statistic on the view after query compilation is the one associated with the clustered index:

The Plan Tree view for the query shows that cardinality estimation is correct for the two table scans and the join, but quite a bit worse for the other plan operators:
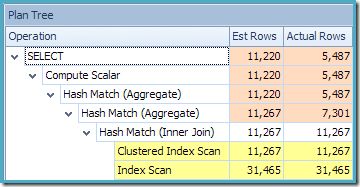
Using the indexed view with a NOEXPAND hint resulted in more accurate estimates for our test query because better quality information was available from statistics on the view – in particular, the statistics associated with the view index.
As a general rule, the accuracy of statistical information degrades quite quickly as it passes through and is modified by query plan operators. Simple joins are often not too bad in this regard, but information about the result of an aggregation is often no better than an educated guess. Providing the query optimizer with more accurate information using statistics on indexed views can be a useful technique to increase plan quality and robustness.
Inferior Plan Without NOEXPAND
The query plan shown above (Standard Edition, without NOEXPAND) is actually less optimal than if we had written the query against the base tables ourselves, rather than allowing the query optimizer to expand the view. The query below expresses the same logical requirement, but does not reference the view:
SELECT
    SOH.CustomerID,
    SUM(OrderQty)
FROM Sales.SalesOrderHeader AS SOH
JOIN Sales.SalesOrderDetail AS SOD
    ON SOD.SalesOrderID = SOH.SalesOrderID
WHERE
    SOD.ProductID BETWEEN 711 AND 718
GROUP BY
    SOH.CustomerID;
This query produces the following execution plan:
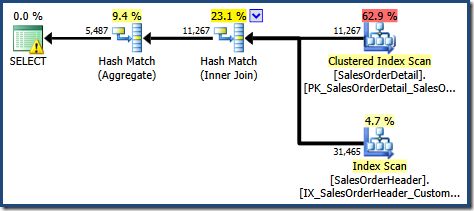
This plan features one less aggregation operation than before. When view expansion was used, the query optimizer was unfortunately unable to remove a redundant aggregation operation, resulting in a less efficient execution plan. The final cardinality estimate for the new query is also slightly better than when the indexed view was referenced without NOEXPAND:
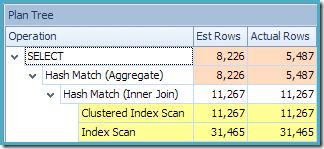
Nevertheless, the best estimates are still those produced when referencing the indexed view with NOEXPAND (repeated below for convenience):

Automatic View Matching
On an Enterprise Edition instance, the query optimizer may be able to use an indexed view even if the query does not mention the view explicitly. If the optimizer is able to match part of the query tree to an indexed view, it can choose to do so, based on its estimation of the costs of using the view or not. The view-matching logic is reasonably clever, but it does have limits that are pretty easy to hit in practice. Even where view matching is successful, the optimizer can still be misled by inaccurate cost estimations.
The EXPAND VIEWS hint
Starting with the rarer of the possibilities, there may be occasions where a query references an indexed view, but a better plan would be obtained by accessing the base tables instead. In these circumstances, the query hint EXPAND VIEWS can be used:
SELECT
    CO.CustomerID,
    SUM(CO.OrderQty)
FROM dbo.CustomerOrders AS CO
WHERE
    CO.ProductID BETWEEN 711 AND 718
GROUP BY
    CO.CustomerID
OPTION (EXPAND VIEWS);
On Enterprise Edition, this query produces the same plan as seen on Standard Edition when the NOEXPAND hint was omitted (including the redundant aggregation operation):


As an aside, the EXPAND VIEWS hint is poorly named, in my opinion. SQL Server always expands view definitions in a query unless the NOEXPAND hint is specified. The EXPAND VIEWS hint disables rules in the optimizer that can match parts of the expanded tree back to indexed views. In the absence of either hint, SQL Server first expands a view to its base table definition, then later considers matching back to indexed views. A better name for the EXPAND VIEWS hint might have been DISABLE INDEXED VIEW MATCHING, because that is what it does.
Note:
In SQL Server 2019 CU22 and later, trace flag 9135 provides EXPAND VIEWS behavior without having to use a query hint.
The EXPAND VIEWS hint is probably most often used to prevent a query against base tables from being matched to an indexed view:
SELECT
    SOH.CustomerID,
    SUM(OrderQty)
FROM Sales.SalesOrderHeader AS SOH
JOIN Sales.SalesOrderDetail AS SOD
    ON SOD.SalesOrderID = SOH.SalesOrderID
WHERE
    SOD.ProductID BETWEEN 711 AND 718
GROUP BY
    SOH.CustomerID
OPTION (EXPAND VIEWS);
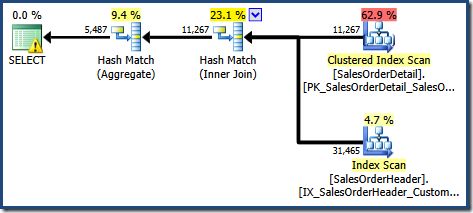
The query hint results in the same execution plan and estimates seen when we were using Standard Edition and the same base-table-only query:

View Matching and Statistics
Even in Enterprise Edition, non-index view statistics are still only created if the NOEXPAND hint is used. To be absolutely clear about it, the Enterprise-only view-matching feature never results in view statistics being created or updated. This unintuitive behaviour is worth exploring a little, as it can have surprising side-effects.
We now execute our basic query against the view on an Enterprise Edition instance, without any hints:
SELECT
    CO.CustomerID,
    SUM(CO.OrderQty)
FROM dbo.CustomerOrders AS CO
WHERE
    CO.ProductID BETWEEN 711 AND 718
GROUP BY
    CO.CustomerID;
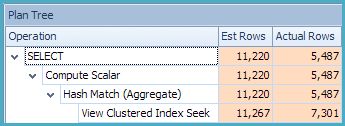
A new thing there is the warning triangle on the View Clustered Index Seek. The tooltip shows the details:
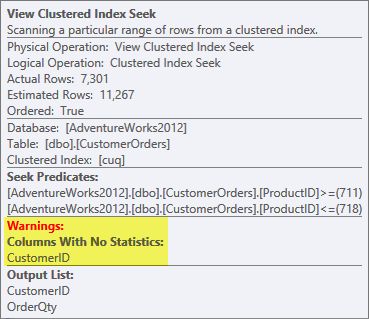
We did not use a NOEXPAND hint, so statistics on the Customer ID column of the indexed view were not automatically created. The statistics on Customer ID are not actually terribly important in this simplified example, but that will not always be the case.
Curious cardinality estimates
The second thing of interest is that the cardinality estimates appear to be worse than any case we have encountered so far, including the Standard Edition examples.
It is initially difficult to see where the cardinality estimate for the View Clustered Index Seek (11,267) came from. We would expect the estimate to be based on Product ID histogram information from the statistics associated with the view clustered index. The relevant part of this histogram is shown below:
DBCC SHOW_STATISTICS
    ('dbo.CustomerOrders', 'cuq')
WITH HISTOGRAM;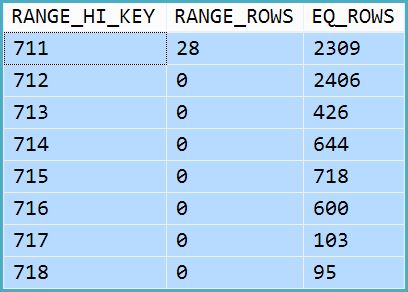
Given that the table has not been modified since the statistics were created, we would expect the estimate to be a simple sum of RANGE_ROWS and EQ_ROWS for Product ID values between 711 and 718 (note the estimate should exclude the 28 RANGE_ROWS shown against the 711 entry since those rows exist below the 711 key value). The sum of the EQ_ROWS shown is 7,301. This is exactly the number of rows actually returned by the view – so where did the 11,267 estimate come from?
The answer lies in the way view matching currently works. Our query did not specify the NOEXPAND hint, so initial cardinality estimations are based on the view-expanded query tree. This is easiest to see by looking again at the estimated plan for the same query with EXPAND VIEWS specified:

The red shaded area represents the part of the tree that is replaced by view matching activity. The output cardinality from this area is 11,267. The unshaded part with the 11,220 estimate is unaffected by view matching. These are exactly the estimates we were looking to explain:

Explanation
View matching simply replaced the red shaded area with a logically-equivalent seek on the indexed view. It did not use statistical information from the view to recompute the cardinality estimate.
To some extent, you can probably appreciate why it might work this way: in general, there is little reason to expect that an estimate computed from one set of statistical information is any better than another. A case could be made that indexed view statistics are more likely to be accurate here, compared with the post-join derived statistics in the red shaded area, but it might be tricky to generalize that, or to correctly account for how quickly various sources of statistical information might go out of date as the underlying data changes.
One could also argue that if we were so sure the indexed view information was better, we would have used a NOEXPAND hint.
Even more curious…
An even more interesting situation arises with Enterprise Edition if we write the query against the base tables and rely on automated view matching:
SELECT
    SOH.CustomerID,
    SUM(OrderQty)
FROM Sales.SalesOrderHeader AS SOH
JOIN Sales.SalesOrderDetail AS SOD
    ON SOD.SalesOrderID = SOH.SalesOrderID
WHERE
    SOD.ProductID BETWEEN 711 AND 718
GROUP BY
    SOH.CustomerID;
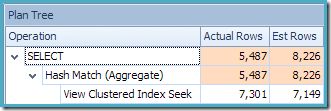
The missing statistics warning is the same as before, and has the same explanation. The more interesting feature is that we now have a lower estimate for the number of rows produced by the View Clustered Index Seek (7,149) and an increased estimate for the number of rows returned from the aggregation (8,226).
To emphasise the point, this query plan seems to be based on the idea that 7,149 source rows can be aggregated to produce 8,226 rows!
Part of the explanation is the same as before. The EXPAND VIEWS query plan, showing the red region which will be replaced by view matching is shown below:
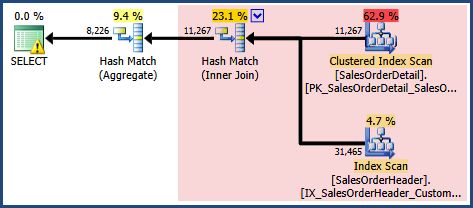
This explains where the final estimate of 8,226 comes from, but what about the 7,149 row estimate? Following the logic seen previously, it appears the view ought to show an estimate of 11,267 rows?
The answer is that the 7,149 estimate is a guess. Yes, really. The indexed view contains 79,433 rows in total. The magic guess percentage for the Product ID BETWEEN predicate is 9%—giving 0.09 * 79433 = 7148.97 rows. The SSMS query plan shows this calculation is exactly correct, even before rounding:

In this situation, the SQL Server optimizer seems to have preferred a guess based on indexed view cardinality over the post-join cardinality estimate from the replaced subtree. Curious.
Summary
Using the NOEXPAND hint guarantees that an indexed view will be used in the final query plan, and enables non-index statistics to be automatically created, maintained, and used by the query optimizer. Using NOEXPAND also ensures the initial cardinality estimates are based on indexed view information rather than being derived from base tables.
If NOEXPAND is not specified, view references are always replaced with their base table definitions before query compilation begins (and therefore before initial cardinality estimation). In Enterprise SKUs only, indexed views may be substituted back into the query tree later in the optimization process.
The EXPAND VIEWS query hint prevents the optimizer from performing Enterprise Edition indexed view matching. This applies whether the query originally referenced an indexed view or not. When view matching is performed, an existing cardinality estimate may be replaced with a guess in some circumstances.
Statistics shown as missing on an indexed view can be created manually, but the optimizer will generally not use them for queries that do not use a NOEXPAND hint.
Using indexed views can improve cardinality estimation, particularly if the view contains joins or aggregations. Queries stand the best chance of benefiting from more accurate view statistics if NOEXPAND is specified.
Thanks for reading.
