Nested Loops Prefetching

Nested loops join query plans can be a lot more interesting (and complicated) than is commonly realized.
One query plan area I get asked about a lot is prefetching. It is not documented in full detail anywhere, so this seems like a good topic to address in a blog post.
The examples used in this article are based on questions asked by Adam Machanic.
Test Query
The following query uses the AdventureWorks sample database. Run it a couple of times if necessary so you see the query plan when all the data needed by the query is in memory (the “warm cache” case):
SELECT TOP (1000)
    P.[Name],
    TH.TransactionID
FROM Production.Product AS P
JOIN Production.TransactionHistory AS TH
    ON TH.ProductID = P.ProductID
WHERE
    P.[Name] LIKE N'[K-P]%'
ORDER BY
    P.[Name],
    TH.TransactionID;
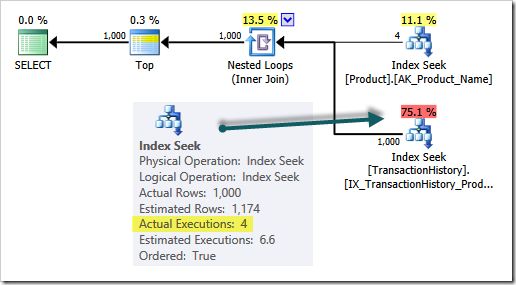
The post-execution (“actual”) plan is shown below:
Plan Execution
Some of you will already know how query plans are executed in detail, but it will be very important in a moment so please take the time to read this next bit, even if it is just as a refresher:
Query execution is an iterative (cursor-like) process. It starts at the far left (the green SELECT icon). Control passes first to the Top iterator, which requests a single row from the Nested Loops join.
The join reads one row from its outer input (using the Index Seek on the Product table) and then looks for the first match on its inner input (the Index Seek on TransactionHistory).
The single-row result is passed up to the Top operator, and ultimately queued for transmission to the client in a TDS packet.
The Top operator then asks the join for another row. The join looks for the next match on its inner input (it does not access the outer input this time). If a row is found, it is passed back to the Top (and on to the client) and so on.
At some point, the join will run out of matches from the inner input (for the current value of ProductID) so it switches back to its outer input to get the next ProductID from the Product table.
The new ProductID is used to reinitialize (rebind) the inner input, which returns the first match from the TransactionHistory table Index Seek using the new ProductID.
Eventually, the whole iterative process results in the 1000th row passing through the Top operator. The process comes to an end because the query specifies TOP 1000.
There is also the possibility that the query tree below (i.e. to the right of) the Top operator produces fewer than 1,000 rows in total. Execution would also come to an end in that case, but that is not what happens here.
The execution plan does not show all this detail (and in particular it aggregates over all the inner-side executions) but it does provide a summary of what happened:
- A total of four rows were read (at different times) from the
Producttable - The
TransactionHistorytable seek was executed four times (with a differentProductIDeach time) - A total of 1,000 rows were returned to the client
The particular detail I want to draw your attention to is highlighted in the query plan above:
The inner side index seek is executed four times, one for each row produced by the outer input to the join.
Given our current understanding of query execution we might conclude:
The number of rows produced by the nested loops join outer input should always match the number of executions reported for the inner input.
Right? Wrong!
Cold Cache Test
The next script runs exactly the same query as before, but with a cold cache:
-- Cold cache test
CHECKPOINT;
DBCC DROPCLEANBUFFERS;
GO
SELECT TOP (1000)
    P.[Name],
    TH.TransactionID
FROM Production.Product AS P
JOIN Production.TransactionHistory AS TH
    ON TH.ProductID = P.ProductID
WHERE
    P.[Name] LIKE N'[K-P]%'
ORDER BY
    P.[Name],
    TH.TransactionID;
The actual execution plan is now:
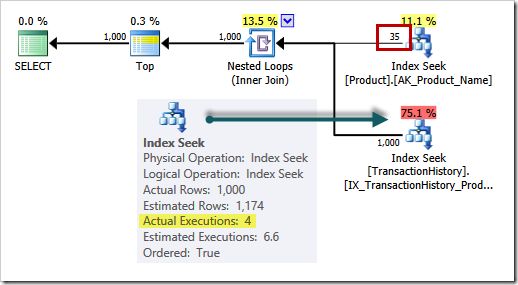
Well that’s odd!
35 rows are read from the outer (Product table) input, but the inner side of the join is only executed 4 times.
What happened to the other 31 outer side rows? Where did they go?
Nested Loops Prefetching
The SQL Server query processor contains a number of optimizations for nested loops joins, primarily aimed at making I/O more efficient.
I/O efficiency on the outer side of the join is not usually a problem. Regular (storage engine) read-ahead is enough to ensure that pages are brought into memory before they are needed.
The same read-ahead mechanism also applies to inner side executions, but the number of rows returned for each outer row is often quite small, so the benefit can be limited or even non-existent.
Remember that the inner side of a nested loop join rebinds (restarts) for each new correlated value from the outer side. As a result, a common access pattern for nested loops join is a number of small range scans on the inner side that start at different points in the same index.
One of the available SQL Server optimizations is nested loops prefetching. The general idea is to issue asynchronous I/O for index pages that will be needed by the inner side — and not just for the current correlated join parameter value, but for future values too.
To be clear: Say the outer side Product table seek produces ProductID rows with values (1, 17, 60, 99).
Nested loops prefetching will try to bring pages in memory for the inner side TransactionHistory table index that has ProductID as its leading key for the values (1, 17, 60, 99…) before the inner side starts working on ProductID 1.
When this mechanism is effective, it can produce a significant performance boost for nested loops joins by overlapping asynchronous prefetch I/O with ongoing nested loop execution.
The way this works is not really discussed anywhere in detail, so let’s look at it now. It will also explain why our cold-cache test query plan shows 35 rows on the outer input but only 4 executions on the inner side.
The Missing Node
The execution plan shows a good deal of useful summary information, but it does not contain every important detail.
One indication that there is something missing from the XML or graphical showplan information comes from looking at the node IDs of the iterators in the plan (if you are using SSMS, the node IDs are shown in the tooltip for each plan iterator):

Query plan iterators (nodes) are numbered (starting with zero) from the far left. A discontinuity in the numbering is often a sign that something has been replaced, or is being hidden.
In our test plan, nodes (0, 1, 3, 4) are shown, but node 2 is conspicuously missing. We can sometimes see extra information about query tree nodes using undocumented trace flag 7352 (output shown below, with node IDs in parentheses):
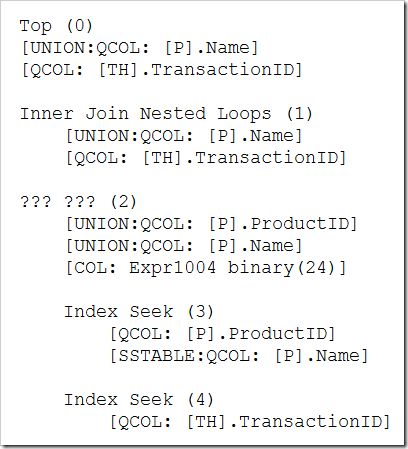
The output reveals the mystery node 2, but the trace flag is unable to give a name for it.
The output also shows that the mystery node uses an expression labelled [Expr1004] with a type of binary(24). This expression is shown in regular showplan output as an outer reference (correlated parameter) of the nested loops join:
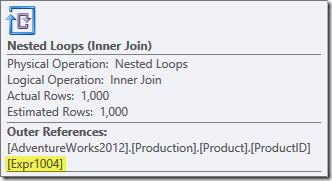
No definition is provided for this expression, and no other explicit reference is made to it anywhere else in the plan.
The Real Execution Plan
If showplan output included the missing node 2, it might look like this:
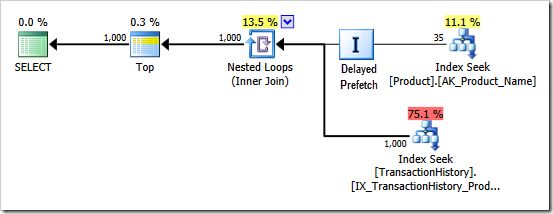
I have labelled the new iterator, “Delayed Prefetch” and used the standard catch-all iterator icon for it because I am too lazy to draw something appropriate (I do not have the illustrative skills of Kendra Little or Michael Swart).
Anyway, the execution engine class that implements this iterator is QScanRangePrefetchDelayNew. It uses the correlated join parameter values (ProductID here) to issue asynchronous scatter/gather I/O for the inner side (TransactionHistory) index, as described earlier.
We have to attach a debugger to see this hidden iterator in action:
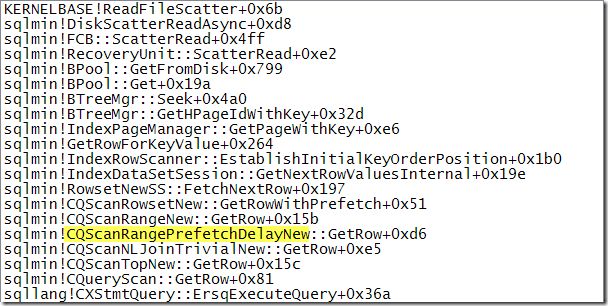
That call stack shows delayed prefetch for the nested loops join resulting in an asynchronous scatter read call to the operating system (right at the top in this capture).
The prefetch operator can issue multiple asynchronous reads based on outer-input values. It uses a small memory buffer to keep track, and to save index leaf page information in particular.
A reference to this information was seen earlier as the outer reference binary (24) expression label Expr1004. My understanding is that the leaf page information is used on the inner side of the join in hints to the storage engine to prevent duplicated effort by the normal read-ahead mechanisms. It may also be used for other purposes.
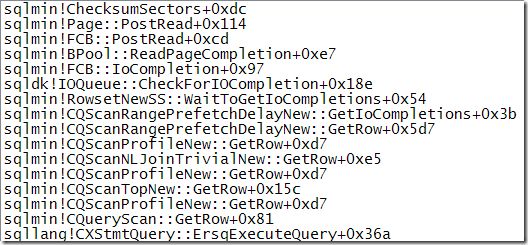
The delayed prefetch iterator also checks for completion of previously-issued asynchronous I/Os:

…and performs the necessary SQL Server processing for any asynchronous I/Os that are found to have completed (the example below shows page checksums being validated):
Details and Explanations
The delayed prefetch iterator only reads extra rows from its input when it encounters a page that requires a physical I/O.
Scatter reads can bring in multiple discontinuous pages in one I/O request, so extra outer side rows are read to make better use of the scatter read mechanism. If we are going to issue an I/O call, we might as well grab as much as we can.
If an inner-side index page checked by delayed prefetch is already present in the buffer pool, no physical I/O is issued (because there is nothing to do) but a logical read is counted (because prefetch touched the buffer pool page to check it was there).
Control then returns to the nested loop join iterator to continue its normal processing. If we know the inner-side page is in memory, we might as well get on with processing it — there’s no need to read extra rows from the outer input.
We can now fully explain the query plan differences we saw earlier.
In the cold-cache test, the delayed prefetch iterator tests inner-side index pages, finds they are not in cache, so asynchronous scatter reads are issued.
A total of 35 rows are read by the delayed prefetch iterator in this test. The 1,000 rows needed for the query are produced by the nested loop join from just 4 of these rows, so we only see 4 executions on the inner side. (Remember the row-at-a-time cursor-like execution of query plans).
In the warm-cache test, the delayed prefetch iterator does not encounter any pages are not in memory, so no asynchronous I/Os are issued, and no extra rows are read. Prefetching just adds a few logical reads (of pages that were already in memory) to the reported cost of the query.
Ordered and Unordered Prefetching
The prefetching mode is shown on the nested loops join iterator. If prefetching is used, either the WithUnorderedPrefetch or WithOrderedPrefetch attributes will be shown set to true (SSMS users will need to click on the nested loops join and inspect the properties window to see these properties).
If prefetching is not used, neither attribute will be present.
An unordered prefetch allows the inner side of the join to proceed using data from whichever I/Os happen to complete first.
An ordered prefetch preserves key order on the inner side of the nested loops join, so SQL Server ensures that asynchronous I/Os are processed in the correct order.
Unordered prefetching may therefore be somewhat more efficient than ordered prefetching. That said, the optimizer may choose to use ordered prefetching where it can make use of the preserved-order guarantee to avoid a more expensive join type (e.g. hash join) or where it can avoid an explicit sort later in the execution plan.
Our test query features an ORDER BY clause that the optimizer can avoid sorting for by using ordered prefetch:

Example with Function Calls
Regular readers will know that I am not a fan of scalar T-SQL functions, but I am going to use one here to illustrate another important aspect of prefetching.
The function in question does nothing except return its input value (I have deliberately created this function without schema binding so SQL Server will consider it to be nondeterministic):
CREATE FUNCTION dbo.F
    (@ProductID integer)
RETURNS integer
AS
BEGIN
    RETURN @ProductID;
END;
The next script uses the function in our test query as part of the join predicate:
SELECT TOP (1000)
    P.[Name],
    TH.TransactionID
FROM Production.Product AS P
JOIN Production.TransactionHistory AS TH
    ON TH.ProductID = dbo.F (P.ProductID) -- Changed!
WHERE
    P.[Name] LIKE N'[K-P]%'
ORDER BY
    P.[Name],
    TH.TransactionID;
The execution plan (with a warm cache) shows 4 rows read from the outer input, and 4 executions of the inner side of the nested loops join:
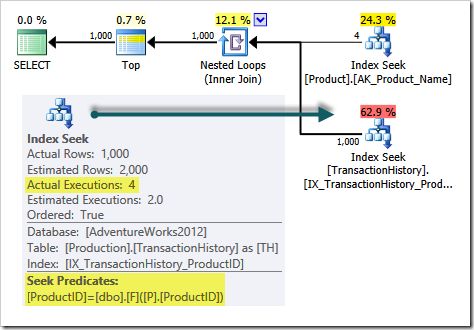
The Seek Predicate for the inner-side seek now references the function. The function is not mentioned anywhere else in the query plan.
How many times is the function executed?
If you said four, you were wrong!
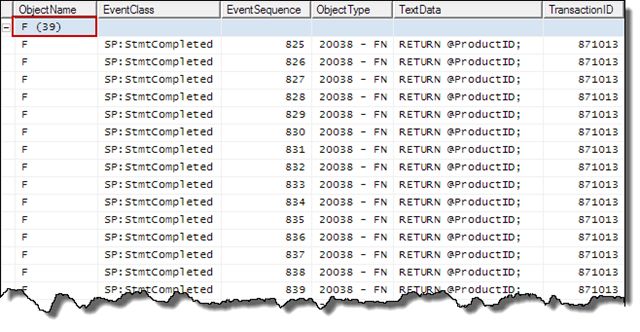
The number of function invocations can be monitored using the Profiler event SP:StatementCompleted (despite the name and documentation suggesting it is only for stored procedures).
The Profiler output shows the function was called eight times:

Four calls correspond to the four executions of the inner-side index seek. The other four calls are associated with the hidden Delayed Prefetch iterator. Remember this is the warm cache case, where no prefetching is necessary.
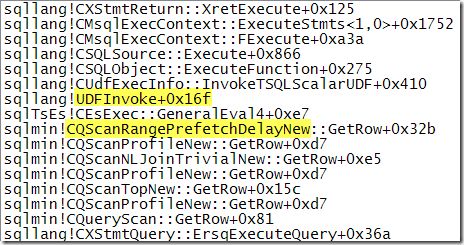
The Delayed Prefetch iterator still tries to check if the index page is in the buffer pool. In order to find the inner-side index page for the current value of ProductID, the prefetch iterator must execute the function. It needs the result of the function to seek into the inner-side index.
The debugger call stack below shows the UDF being called from the Delayed Prefetch iterator:
Cold Cache
When pages need to be prefetched, the effect is even more dramatic:
CHECKPOINT;
DBCC DROPCLEANBUFFERS;
GO
SELECT TOP (1000)
    P.[Name],
    TH.TransactionID
FROM Production.Product AS P
JOIN Production.TransactionHistory AS TH
    ON TH.ProductID = dbo.F (P.ProductID)
WHERE
    P.[Name] LIKE N'[K-P]%'
ORDER BY
    P.[Name],
    TH.TransactionID;
The outer input shows 35 rows (as we now expect). There are still only 4 executions of the inner side:
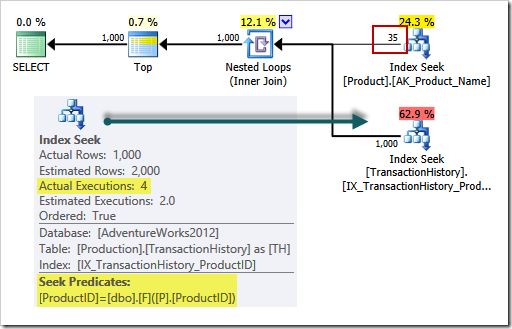
Profiler shows the function is executed 39 times — 4 times by the inner side seek, and 35 times by prefetch!
Final Words
The message here is not that prefetching is bad; it is generally a good thing for performance. It can have unexpected side-effects, and can make interpreting nested loops joins a bit more challenging.
Additional Reading:
- Prefetch and Query Performance by Fabiano Amorim
- Random Prefetching by Craig Freedman
- Optimized Nested Loops Joins by Craig Freedman
- Optimizing I/O Performance by Sorting – Craig Freedman
