Improving Partitioned Table Join Performance

The query optimizer does not always choose an optimal strategy when joining partitioned tables. This post looks at an example of that, showing how a manual rewrite of the query can almost double performance, while reducing the memory grant to almost nothing.
Test Data
The two tables in this example are both partitioned, using a common partitioning scheme. The partition function uses 41 equal-size partitions:
CREATE PARTITION FUNCTION PFT (integer)
AS RANGE RIGHT
FOR VALUES
    (
        125000, 250000, 375000, 500000,
        625000, 750000, 875000, 1000000,
        1125000, 1250000, 1375000, 1500000,
        1625000, 1750000, 1875000, 2000000,
        2125000, 2250000, 2375000, 2500000,
        2625000, 2750000, 2875000, 3000000,
        3125000, 3250000, 3375000, 3500000,
        3625000, 3750000, 3875000, 4000000,
        4125000, 4250000, 4375000, 4500000,
        4625000, 4750000, 4875000, 5000000
    );
GO
CREATE PARTITION SCHEME PST
AS PARTITION PFT
ALL TO ([PRIMARY]);
The two tables are:
CREATE TABLE dbo.T1
(
    TID integer NOT NULL IDENTITY(0,1),
    Column1 integer NOT NULL,
    Padding binary(100) NOT NULL DEFAULT 0x,

    CONSTRAINT PK_T1
        PRIMARY KEY CLUSTERED (TID)
        ON PST (TID)
);

CREATE TABLE dbo.T2
(
    TID integer NOT NULL,
    Column1 integer NOT NULL,
    Padding binary(100) NOT NULL DEFAULT 0x,

    CONSTRAINT PK_T2
        PRIMARY KEY CLUSTERED (TID, Column1)
        ON PST (TID)
);
The next script loads 5 million rows into T1 with a pseudo-random value between 1 and 5 for Column1 and ensures top-quality statistics are available. The table is partitioned on the IDENTITY column TID:
INSERT dbo.T1
    WITH (TABLOCKX)
    (Column1)
SELECT
    (ABS(CHECKSUM(NEWID())) % 5) + 1
FROM dbo.Numbers AS N
WHERE
    N.n BETWEEN 1 AND 5000000;

UPDATE STATISTICS
    dbo.T1 (PK_T1)
WITH FULLSCAN;

CREATE STATISTICS
    [stats dbo.T1 Column1]
ON dbo.T1 (Column1)
WITH FULLSCAN;
In case you don’t already have a table of numbers, here is a script to create the Numbers table used above (with 10 million rows):
IF OBJECT_ID(N'dbo.Numbers', N'U') IS NOT NULL
BEGIN
    DROP TABLE dbo.Numbers;
END;
GO
WITH Ten(N) AS
(
    SELECT 1 UNION ALL SELECT 1 UNION ALL
    SELECT 1 UNION ALL SELECT 1 UNION ALL
    SELECT 1 UNION ALL SELECT 1 UNION ALL
    SELECT 1 UNION ALL SELECT 1 UNION ALL
    SELECT 1 UNION ALL SELECT 1
)
SELECT
	n = IDENTITY(int, 1, 1)
INTO dbo.Numbers
FROM Ten AS T10
CROSS JOIN Ten AS T100
CROSS JOIN Ten AS T1000
CROSS JOIN Ten AS T10000
CROSS JOIN Ten AS T100000
CROSS JOIN Ten AS T1000000
CROSS JOIN Ten AS T10000000
ORDER BY n
    OFFSET 0 ROWS
    FETCH FIRST 10 * 1000 * 1000 ROWS ONLY
OPTION
    (MAXDOP 1);
GO
ALTER TABLE dbo.Numbers
ADD CONSTRAINT [PK dbo.Numbers n]
PRIMARY KEY CLUSTERED (n)
WITH
(
    SORT_IN_TEMPDB = ON,
    MAXDOP = 1,
    FILLFACTOR = 100
);
Table T1 now contains data like this:
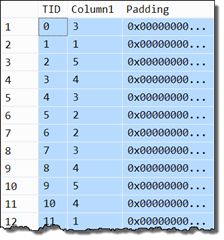
Next we load data into table T2 and ensure good statistics are available. The relationship between the two tables is that table 2 contains ‘n’ rows for each row in table 1, where ‘n’ is determined by the value in Column1 of table T1. There is nothing particularly special about the data or distribution, by the way.
INSERT dbo.T2
    WITH (TABLOCKX)
    (TID, Column1)
SELECT
    T.TID,
    N.n
FROM dbo.T1 AS T
JOIN dbo.Numbers AS N
    ON N.n >= 1
    AND N.n <= T.Column1;

UPDATE STATISTICS
    dbo.T2 (PK_T2)
WITH FULLSCAN;

CREATE STATISTICS
    [stats dbo.T2 Column1]
ON dbo.T2 (Column1)
WITH FULLSCAN;
Table T2 ends up containing about 15 million rows like this:
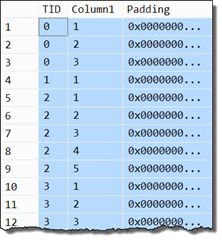
The primary key for table T2 is a combination of TID and Column1. The data is partitioned according to the value in column TID alone.
Partition Distribution
The following query shows the number of rows in each partition of table T1:
SELECT
    PartitionID = CA1.P,
    NumRows = COUNT_BIG(*)
FROM dbo.T1 AS T
CROSS APPLY
(
    VALUES ($PARTITION.PFT(T.TID))
) AS CA1 (P)
GROUP BY
    CA1.P
ORDER BY
    CA1.P;
The output shows 125,000 rows in each partition:
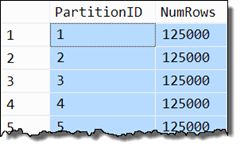
There are 40 partitions containing 125,000 rows (40 * 125k = 5m rows). The rightmost partition remains empty.
The next query shows the distribution for table T2:
SELECT
    PartitionID = CA1.P,
    NumRows = COUNT_BIG(*)
FROM dbo.T2 AS T
CROSS APPLY
(
    VALUES ($PARTITION.PFT(T.TID))
) AS CA1 (P)
GROUP BY
    CA1.P
ORDER BY
    CA1.P;
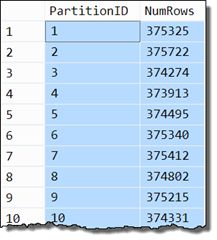
There are roughly 375,000 rows in each partition (the rightmost partition is also empty):
The sample data we need is now loaded.
Test Query and Execution Plan
The task is to count the rows resulting from joining tables T1 and T2 on the TID column:
SET STATISTICS IO ON;

DECLARE @s datetime2(7) = SYSUTCDATETIME();

SELECT
    COUNT_BIG(*)
FROM dbo.T1 AS T1
JOIN dbo.T2 AS T2
    ON T2.TID = T1.TID;

-- Elapsed time
SELECT DATEDIFF(MILLISECOND, @s, SYSUTCDATETIME());

SET STATISTICS IO OFF;
The optimizer chooses a plan using parallel hash join, and partial aggregation:

The Plan Explorerplan tree view shows accurate cardinality estimates and an even distribution of rows across threads:

With a warm data cache, the STATISTICS IO output shows that no physical I/O was needed, and all 41 partitions were touched:
Table 'T1'.
    Scan count 41,
    logical reads 82240,
    physical reads 0,
    read-ahead reads 0
Table 'T2'.
    Scan count 41,
    logical reads 246463,
    physical reads 0,
    read-ahead reads 0
Running the query without actual execution plan or STATISTICS IO information (for maximum performance), the query returns complete results in around 2600ms on my laptop.
Execution Plan Analysis
The first step toward improving on the execution plan produced by the query optimizer is to understand how it works, at least in outline:
The two parallel Clustered Index Scans use multiple threads to read rows from tables T1 and T2. Parallel scan uses a demand-based scheme where threads are given page(s) to scan from the table as needed. This arrangement has certain important advantages, but does result in an unpredictable distribution of rows among threads. Anyway, the broader point is that multiple threads cooperate to scan the whole table, but it is impossible to predict which rows will end up on which threads.
For correct results from the row-mode parallel hash join, the execution plan has to ensure that rows from T1 and T2 that might join are processed on the same thread.
For example, if a row from T1 with join key value ‘1234’ is placed in thread 5’s hash table, the execution plan must guarantee that any rows from T2 that also have join key value ‘1234’ will probe into thread 5’s hash table for matches.
The way this guarantee is enforced in this row-mode parallel hash join plan is by repartitioning rows among threads after each parallel scan. The two repartitioning exchanges (Parallelism operators) route rows to threads using a hash function on the hash join keys.
Importantly, the two repartitioning exchanges use the same hash function so rows from T1 and T2 with the same join key must end up being handled by the same hash join thread.
Expensive Exchanges
This business of repartitioning rows between threads can be expensive, especially if a large number of rows is involved. The execution plan selected by the optimizer moves 5 million rows through one repartitioning exchange and around 15 million across the other.
As a first step toward removing these exchanges, consider the execution plan selected by the optimizer if we join just one partition from each table, disallowing parallelism:
SELECT
    COUNT_BIG(*)
FROM dbo.T1 AS T1
JOIN dbo.T2 AS T2
    ON T2.TID = T1.TID
WHERE
    $PARTITION.PFT(T1.TID) = 1
    AND $PARTITION.PFT(T2.TID) = 1
OPTION (MAXDOP 1);
The execution plan is:
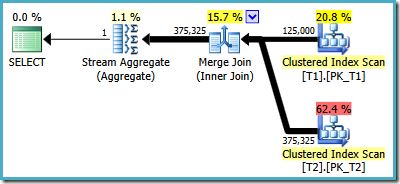
The optimizer has chosen a (one-to-many) Merge Join instead of a hash join. This single-partition join query completes in around 100ms.
If everything scaled linearly, we would expect that extending this strategy to all 40 populated partitions would result in an execution time around 4000ms. Using parallelism could reduce that further, perhaps to be competitive with the parallel hash join originally chosen by the optimizer for the full query.
This raises a question: If the most efficient way to join one partition from each of the tables is to use a merge join, why does the optimizer not choose a merge join for the full query?
Forcing a Merge Join
Let’s force the optimizer to use a merge join on the test query using a hint:
SELECT
    COUNT_BIG(*)
FROM dbo.T1 AS T1
JOIN dbo.T2 AS T2
    ON T2.TID = T1.TID
OPTION (MERGE JOIN);
This is the execution plan selected by the optimizer:
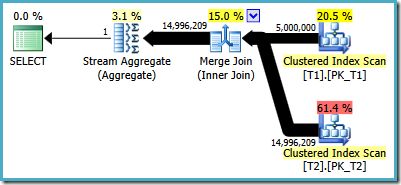
This results in the same number of logical reads reported previously, but instead of 2600ms the query takes 5000ms.
The natural explanation for this drop in performance is that the merge join plan is only using a single thread, whereas the parallel hash join plan could use multiple threads.
Parallel Merge Join
We can get a parallel merge join plan using the same query hint as before, and adding undocumented trace flag 8649 or by using an undocumented query hint:
SELECT
    COUNT_BIG(*)
FROM dbo.T1 AS T1
JOIN dbo.T2 AS T2
    ON T2.TID = T1.TID
OPTION
(
    MERGE JOIN,
    QUERYTRACEON 8649
);

-- SQL Server 2016 SP1 CU2 and later
SELECT
    COUNT_BIG(*)
FROM dbo.T1 AS T1
JOIN dbo.T2 AS T2
    ON T2.TID = T1.TID
OPTION
(
    MERGE JOIN,
    USE HINT ('ENABLE_PARALLEL_PLAN_PREFERENCE')
);
The execution plan is:

This looks promising. It uses a similar strategy to distribute work across threads as seen for the parallel hash join.
In practice though, performance is disappointing. On a typical run, the parallel merge join plan runs for around 8400ms, which is slower than the single-threaded merge join plan (5000ms) and much worse than the 2600ms for the parallel hash join. We seem to be going backwards!
The logical reads for the parallel merge are still exactly the same as before, with no physical IOs. The cardinality estimates and thread distribution are also still very good:

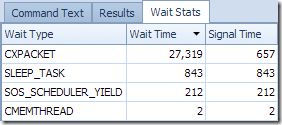
A big clue to the reason for the poor performance is shown in the wait statistics (captured by running the query in Plan Explorer):
A separate run on a SQL Server 2017 instance produced these wait stats, showing the newer CXCONSUMER wait type (this is provided for interest, the numbers are not directly comparable):
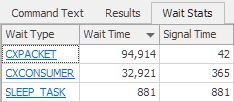
CXPACKET waits require careful interpretation, and are often benign, but in this case excessive waiting occurs at the repartitioning exchanges.
Unlike the parallel hash join, the repartitioning exchanges in this plan are order-preserving (aka merging) exchanges (because merge join requires ordered inputs). This is shown by the presence of an Order By property on the exchange:
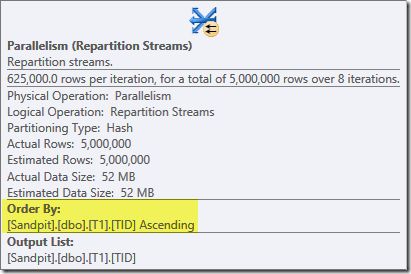
Parallelism works best when threads can just grab any available unit of work and get on with processing it. Preserving order introduces inter-thread dependencies that can easily lead to significant waits occurring. In extreme cases, these dependencies can result in an intra-query deadlock.
The potential for waits and parallel deadlocks leads the query optimizer to cost parallel merge join relatively highly, especially as the degree of parallelism (DOP) increases. This high costing resulted in the optimizer choosing a serial merge join rather than parallel in this case. The test results certainly confirm its reasoning in this case.
Collocated Joins
The optimizer has another available strategy when joining tables that share a common (or equivalent) partitioning function. This strategy is a called a collocated join, also known as as a per-partition join. It can be applied in both serial and parallel execution plans, though it is limited to two-way joins in the current optimizer.
Whether the optimizer chooses a collocated join or not depends on cost estimation. The primary benefits of a collocated join are that it eliminates an exchange and requires less memory, as we will see next.
Costing and Plan Selection
The query optimizer did consider a collocated join for our original query, but it was rejected on cost grounds—the parallel hash join with repartitioning exchanges appeared to be the cheaper option.
There is no query hint to force a collocated join, so we have to mess with the costing framework to produce one for our test query. Pretending that IOs cost 50 times more than usual is enough to convince the optimizer to use collocated join, when the original (legacy) cardinality estimator is used:
-- Pretend IOs are 50x cost temporarily
-- WARNING! UNDOCUMENTED! UNSAFE!
-- See https://sql.kiwi/2010/09/inside-the-optimizer-plan-costing/
DBCC SETIOWEIGHT(50);
GO
-- Co-located hash join
SELECT
    COUNT_BIG(*)
FROM dbo.T1 AS T1
JOIN dbo.T2 AS T2
    ON T2.TID = T1.TID
OPTION
(
    -- Fresh plan
    RECOMPILE,
    -- Original CE model
    QUERYTRACEON 9481
);
GO
-- IMPORTANT!
-- Reset IO costing to standard
DBCC SETIOWEIGHT(1);
Instead of QUERYTRACEON 9481, you may be able to use the query hint USE HINT ('FORCE_LEGACY_CARDINALITY_ESTIMATION'). In any case, the point is to avoid the cardinality estimation model introduced in SQL Server 2014 to get a collocated hash join plan.
Collocated Hash Join Plan
The estimated execution plan for the collocated hash join is:
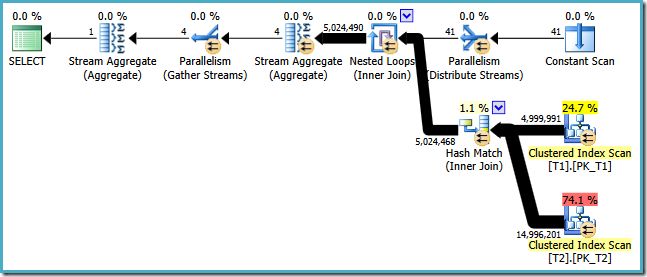
The Constant Scan operator contains one row for each partition ID of the shared partition function, from 1 to 41. The hash repartitioning exchanges seen previously are replaced by a single Distribute Streams exchange using Demand partitioning. Demand partitioning means that the next partition ID is given to the next parallel thread that asks for one.
My test machine has eight logical processors, and all are available for SQL Server to use. As a result, there are eight threads in the single parallel branch in this plan, each processing one partition from each table at a time.
Once a thread finishes processing a partition, it grabs a new partition number from the Distribute Streams exchange…and so on until all partitions have been processed.
It is important to understand that the parallel scans in this plan are different from the parallel hash join plan. Although the scans have the same parallelism icon, tables T1 and T2 are not being cooperatively scanned by multiple threads in the same way.
Each thread reads a single partition of T1 and performs a hash match join with the same partition from table T2. The properties of the two Clustered Index Scans show a Seek Predicate (unusual for a scan!) limiting it to a single partition:
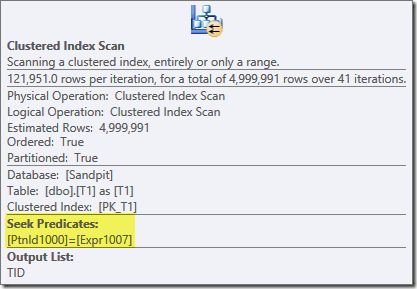
The crucial point is that the join between T1 and T2 is on TID, and TID is the partitioning column for both tables.
A thread that processes partition ‘n’ is guaranteed to see all rows that can possibly join on TID for that partition. In addition, no other thread will see rows from that partition, so this removes the need for repartitioning exchanges.
CPU and Memory Efficiency Improvements
The collocated join has removed two expensive repartitioning exchanges and added a single exchange processing 41 rows (one for each partition ID).
Remember, the parallel hash join plan exchanges had to process 5 million and 15 million rows. The amount of processor time spent on exchanges will be much lower in the collocated join plan.
In addition, the collocated join plan has a maximum of 8 threads processing single partitions at any one time. The 41 partitions will all be processed eventually, but a new partition is not started until a thread asks for it. Threads can therefore reuse hash table memory for the new partition.
The parallel hash join plan also had 8 hash tables, but with all 5,000,000 build rows loaded at the same time. The collocated plan needs memory for only 8 * 125,000 = 1,000,000 rows at any one time.
Collocated Hash Join Performance
The collated hash join plan has disappointing performance in this case. The query runs for around 25,300ms despite the same IO statistics as usual. This is much the worst result so far, so what went wrong?
It turns out that cardinality estimation for the single partition scans of table T1 is slightly low. The properties of the Clustered Index Scan of T1 (graphic immediately above) show the estimation was for 121,951 rows. This is a small shortfall compared with the 125,000 rows actually encountered, but it was enough to cause the hash join to spill to physical tempdb:
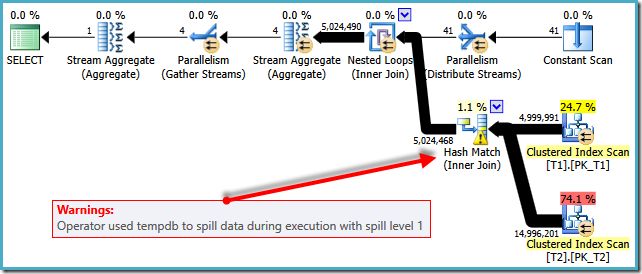
A level 1 spill doesn’t sound too bad, until you realize that the spill to tempdb probably occurs for each of the 41 partitions.
As a side note, the cardinality estimation error is a little surprising because the system tables accurately show there are 125,000 rows in every partition of T1. Unfortunately, the optimizer uses regular column and index statistics to derive cardinality estimates here rather than system table information (e.g. sys.partitions).
Collocated Merge Join
We will never know how well the collocated parallel hash join plan might have worked without the cardinality estimation error (and the resulting 41 spills to tempdb) but we do know:
- Merge join does not require a memory grant; and
- Merge join was the optimizer’s preferred join option for a single partition join
Putting this all together, what we would really like to see is the same collocated join strategy, but using merge join instead of hash join.
Unfortunately, the query processor cannot currently (up to and including SQL Server 2019 CTP 2.2) produce a collocated merge join—it only knows how to perform a collocated hash join.
SQL Server 2005 used an APPLY pattern to join partitioned tables, so a collocated merge join was possible in that version.
So where does this leave us?
CROSS APPLY sys.partitions
We can try to write our own collocated join query. We can use sys.partitions to find the partition numbers, and CROSS APPLY to get a count per partition, with a final step to sum the partial counts.
The following query implements this idea:
SELECT
    row_count = SUM(Subtotals.cnt)
FROM
(
    -- Partition numbers
    SELECT DISTINCT
        P.partition_number
    FROM sys.partitions AS P
    WHERE
        P.[object_id] = OBJECT_ID(N'T1', N'U')
        AND P.index_id = 1
) AS P
CROSS APPLY
(
    -- Count per collocated join
    SELECT
        cnt = COUNT_BIG(*)
    FROM dbo.T1 AS T1
    JOIN dbo.T2 AS T2
        ON T2.TID = T1.TID
    WHERE
        $PARTITION.PFT(T1.TID) = p.partition_number
        AND $PARTITION.PFT(T2.TID) = p.partition_number
) AS SubTotals;
The estimated plan is:
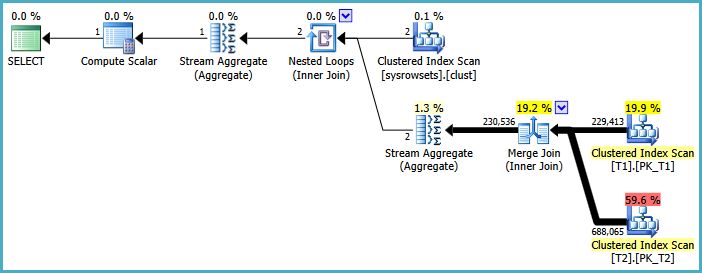
The cardinality estimates aren’t all that good here, especially the estimate for the scan of the system table(s) underlying the sys.partitions view.
Nevertheless, the plan shape is heading toward where we would like to be. Each partition number from the system table results in a per-partition scan of T1 and T2, a one-to-many Merge Join, and a Stream Aggregate to compute the partial counts. The final (global) Stream Aggregate just sums the partial counts.
Execution time for this query is around 3,500ms, with the same IO statistics as always. This compares favourably with 5,000ms for the serial plan produced by the optimizer with the OPTION (MERGE JOIN) hint.
This is a case of the sum of the parts being less than the whole—summing 41 partial counts from 41 single-partition merge joins is faster than a single merge join and count over all partitions.
Even so, this single-threaded collocated merge join is not as quick as the original parallel hash join plan, which executed in 2,600ms.
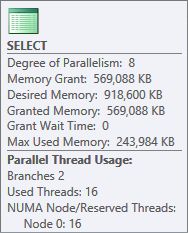
On the positive side, our collocated merge join uses only one logical processor and requires no memory grant. The parallel hash join plan used 16 threads and reserved 569 MB of memory:
Using a Temporary Table
Our collocated merge join plan would benefit from parallelism. The reason parallelism is not being used is that the query references a system table.
We can work around that by writing the partition numbers to a temporary table (or table variable):
SET STATISTICS IO ON;

DECLARE @s datetime2(7) = SYSUTCDATETIME();

CREATE TABLE #P
(
    partition_number integer NOT NULL,

    PRIMARY KEY CLUSTERED (partition_number)
);

INSERT #P
    (partition_number)
SELECT
    P.partition_number
FROM sys.partitions AS P
WHERE
    P.[object_id] = OBJECT_ID(N'T1', N'U')
    AND P.index_id = 1;

SELECT
    row_count = SUM(Subtotals.cnt)
FROM #P AS P
CROSS APPLY
(
    SELECT
        cnt = COUNT_BIG(*)
    FROM dbo.T1 AS T1
    JOIN dbo.T2 AS T2
        ON T2.TID = T1.TID
    WHERE
        $PARTITION.PFT(T1.TID) = P.partition_number
        AND $PARTITION.PFT(T2.TID) = P.partition_number
) AS SubTotals;

DROP TABLE #P;

SELECT DATEDIFF(MILLISECOND, @s, SYSUTCDATETIME());

SET STATISTICS IO OFF;
Using the temporary table adds a few logical reads, but the overall execution time is still around 3500ms, indistinguishable from the same query without the temporary table.
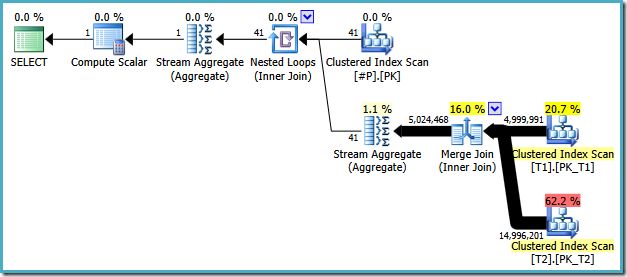
The problem is that the query optimizer still doesn’t choose a parallel plan for this query, though the removal of the system table reference means that it could if it wanted to. This is the execution plan:
In fact, the optimizer did enter the parallel plan phase of query optimization (running search 1 for a second time, with a parallel plan as a requirement). This is revealed by the output of undocumented trace flag 8675 when 3604 is also on:
End of simplification
end search(0),  cost: 13517.3 tasks: 271
end search(1),  cost: 311.19 tasks: 489
end search(1),  cost: 311.19 tasks: 589
End of post optimization rewrite
End of query plan compilation
Unfortunately, the parallel plan found seemed to be no cheaper than the serial plan. This is an annoying result, caused by the optimizer’s cost model not reducing operator CPU costs on the inner side of a nested loops join. Don’t get me started on that.
In this plan, everything expensive happens on the inner side of a nested loops join. Without a CPU cost reduction to compensate for the added cost of exchange operators, candidate parallel plans always look more expensive to the optimizer than the equivalent serial plan. Annoying.
Parallel Collocated Merge Join
We can produce the desired parallel plan using trace flag 8649 (or these equivalent query hint) again:
CREATE TABLE #P
(
    partition_number integer NOT NULL,

    PRIMARY KEY CLUSTERED (partition_number)
);

INSERT #P
    (partition_number)
SELECT
    P.partition_number
FROM sys.partitions AS P
WHERE
    P.[object_id] = OBJECT_ID(N'T1', N'U')
    AND P.index_id = 1;

SELECT
    row_count = SUM(Subtotals.cnt)
FROM #P AS P
CROSS APPLY
(
    SELECT
        cnt = COUNT_BIG(*)
    FROM dbo.T1 AS T1
    JOIN dbo.T2 AS T2
        ON T2.TID = T1.TID
    WHERE
        $PARTITION.PFT(T1.TID) = P.partition_number
        AND $PARTITION.PFT(T2.TID) = P.partition_number
) AS SubTotals
OPTION (QUERYTRACEON 8649);

DROP TABLE #P;
The actual execution plan is:

One difference between this plan and the collocated hash join plan is that a Repartition Streams exchange operator is used instead of Distribute Streams.
The effect is similar, though not quite identical. The Repartition uses round-robin partitioning, meaning the next partition ID is pushed to the next thread in sequence. The Distribute Streams exchange seen earlier used Demand partitioning, meaning the next partition ID is pulled across the exchange by the next thread that is ready for more work.
There are subtle performance implications for each partitioning option, but going into that would again take us too far off the main point of this post.
Performance
The important thing is the performance of this parallel collocated merge join—just 1350ms on a typical run.
The list below shows all the alternatives from this post (all timings include creation, population, and deletion of the temporary table where appropriate) from quickest to slowest:
- Collocated parallel merge join: 1350ms
- Parallel hash join: 2600ms
- Collocated serial merge join: 3500ms
- Serial merge join: 5000ms
- Parallel merge join: 8400ms
- Collated parallel hash join: 25,300ms (hash spill per partition)
The parallel collocated merge join requires no memory grant (aside from a tiny 1.2MB used for exchange buffers).
This plan uses 16 threads at DOP 8; but 8 of those are (rather pointlessly) allocated to the parallel scan of the temporary table. These are minor concerns, but it turns out there is a way to address them if it bothers you.
Parallel Collocated Merge Join with Demand Partitioning
This final tweak replaces the temporary table with a hard-coded list of partition IDs. Dynamic SQL could be used to generate this query from sys.partitions:
SELECT
    row_count = SUM(Subtotals.cnt)
FROM
(
    VALUES
        (01),(02),(03),(04),(05),(06),(07),(08),(09),(10),
        (11),(12),(13),(14),(15),(16),(17),(18),(19),(20),
        (21),(22),(23),(24),(25),(26),(27),(28),(29),(30),
        (31),(32),(33),(34),(35),(36),(37),(38),(39),(40),
        (41)
) AS P (partition_number)
CROSS APPLY
(
    SELECT
        cnt = COUNT_BIG(*)
    FROM dbo.T1 AS T1
    JOIN dbo.T2 AS T2
        ON T2.TID = T1.TID
    WHERE
        $PARTITION.PFT(T1.TID) = P.partition_number
        AND $PARTITION.PFT(T2.TID) = P.partition_number
) AS SubTotals
OPTION (QUERYTRACEON 8649);
The actual execution plan is:
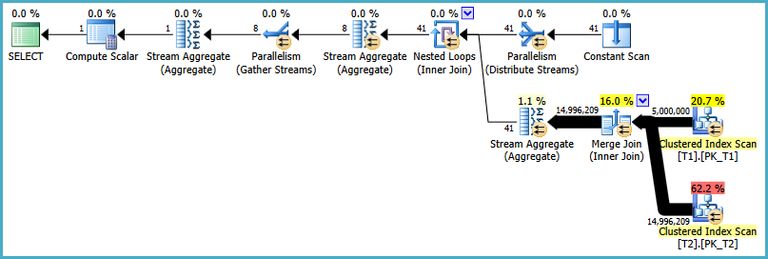
The parallel collocated hash join plan is reproduced below for comparison:
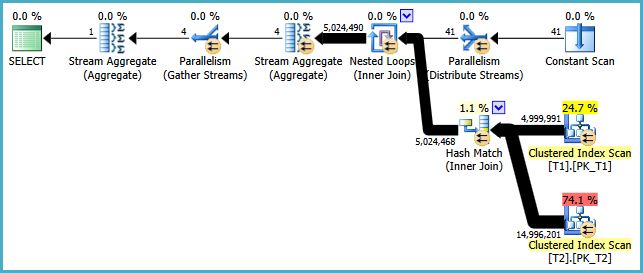
The manual rewrite has another advantage that has not been mentioned so far: The partial counts (per partition) can be computed earlier than the partial counts (per thread) in the optimizer’s collocated join plan. The earlier aggregation is performed by the extra Stream Aggregate under the nested loops join.
The performance of the parallel collocated merge join is unchanged at around 1350ms.
Final Words
It is a shame that the current query optimizer does not consider a collocated merge join (archive of a Connect item closed as Won’t Fix).
The example used in this post showed an improvement in execution time from 2600ms to 1350ms using a modestly-sized data set and limited parallelism. In addition, the memory requirement for the query was almost completely eliminated – down from 569MB to 1.2MB.
The problem with the parallel hash join selected by the optimizer is that it attempts to process the full data set all at once (albeit using eight threads). It requires a large memory grant to hold all 5 million rows from table T1 across the eight hash tables, and does not take advantage of the divide-and-conquer opportunity offered by the common partition function.
The great thing about the collocated join strategies is that each parallel thread works on a single partition from both tables, reading rows, performing the join, and computing a per-partition subtotal, before moving on to a new partition.
Note that this general technique is not limited to partitioned tables. Any table that can be naturally segmented using a driver table of values can be written to use a collocated merge join, by substituting a driver value for the partition ID.
From a thread’s point of view…
If you have trouble visualizing what is happening from just looking at the parallel collocated merge join execution plan, let’s look at it again, but from the point of view of just one thread operating between the two Parallelism (exchange) operators:
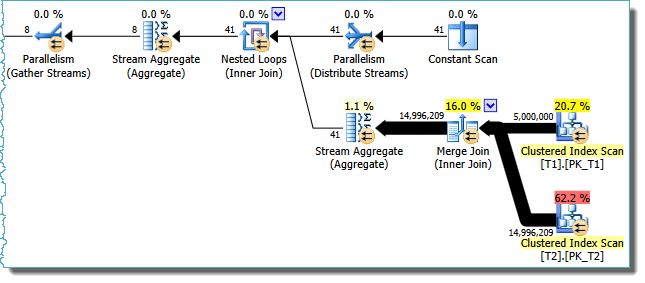
Our thread picks up a single partition ID from the Distribute Streams exchange, and starts a Merge Join using ordered rows from partition 1 of table T1 and partition 1 of table T2.
By definition, this is all happening on a single thread. As rows join, they are added to a (per-partition) count in the Stream Aggregate immediately above the Merge Join. Eventually, either T1 (partition 1) or T2 (partition 1) runs out of rows and the Merge Join stops.
The per-partition count from the aggregate passes on through the Nested Loops Join to another Stream Aggregate, which is maintaining a per-thread subtotal.
Our thread now picks up a new partition ID from the exchange (say it gets partition ID #9 this time). The count in the per-partition aggregate is reset to zero, and the processing of partition 9 of both tables proceeds just as it did for partition 1, on the same thread.
Each thread picks up a single partition ID and processes all the data for that partition, completely independently from other threads working on other partitions. One thread might eventually process partitions (1, 9, 17, 25, 33, 41) while another is concurrently processing partitions (2, 10, 18, 26, 34) and so on for the other six threads at DOP 8.
The point is that all 8 threads can execute independently and concurrently, continuing to process new partitions until the wider job (of which the thread has no knowledge!) is done. This divide-and-conquer technique can be much more efficient than simply splitting the entire workload across eight threads all at once.
