Compute Scalars, Expressions and Execution Plan Performance

The humble Compute Scalar is one of the least well-understood of the execution plan operators, and usually the last place people look for query performance problems. It often appears in execution plans with a very low (or even zero) cost, which goes some way to explaining why people ignore it.

Some readers will already know that a Compute Scalar can contain a call to a user-defined function, and that any (non-inlined) T-SQL function with a BEGIN…END block in its definition can have truly disastrous consequences for performance (see When is a SQL function not a function? by Rob Farley for details).
This post is not about those sorts of concerns.
Compute Scalars
The documentation description of this operator is not very detailed:
The Compute Scalar operator evaluates an expression to produce a computed scalar value. This may then be returned to the user, referenced elsewhere in the query, or both. An example of both is in a filter predicate or join predicate. Compute Scalar is a logical and physical operator.
This leads people to think that Compute Scalar behaves like the majority of other operators: As rows flow through it, the results of whatever computations the Compute Scalar contains are added to the stream.
This is not generally true. Despite the name, Compute Scalar does not always compute anything, and does not always contain a single scalar value (it can be a vector, an alias, or even a Boolean predicate, for example).
More often than not, a Compute Scalar simply defines an expression; the actual computation is deferred until something later in the execution plan needs the result.
Note: Compute Scalars are not the only operators that can define expressions. You can find expression definitions with labels like [Expr1008] in many query plan operators, including Constant Scans, Stream Aggregates, and even Inserts.
Deferred expression evaluation was introduced in SQL Server 2005 as a performance optimization. The idea is that the number of rows tends to decrease in later parts of the plan due to the effects of filtering and joining (reducing the number of expression evaluations at runtime).
To be fair to the current product documentation (updated since this post was first written), it does go on to mention this behaviour:
Compute Scalar operators that appear in Showplans generated by
SET STATISTICS XMLmight not contain the RunTimeInformation element. In graphical Showplans, Actual Rows, Actual Rebinds, and Actual Rewinds might be absent from the Properties window when the Include Actual Execution Plan option is selected in SQL Server Management Studio. When this occurs, it means that although these operators were used in the compiled query plan, their work was performed by other operators in the run-time query plan. Also note that the number of executes in Showplan output generated bySET STATISTICS PROFILEis equivalent to the sum of rebinds and rewinds in Showplans generated bySET STATISTICS XML.
The take away from this first section is that a Compute Scalar is most often just a placeholder in the execution plan. It defines an expression and assigns a label to it (e.g. [Expr1000]) but no calculations are performed at that point.
The defined expression may be referenced by multiple operators later in the execution plan. This makes counting the number of ‘executions’ more complex than for a regular plan operator., and goes some way to explaining why Compute Scalar operators nearly always only show estimated row counts (even in an ‘actual’ execution plan).
Execution Plans and the Expression Service
The execution plans you see in Management Studio (or Plan Explorer) are a highly simplified representation that is nevertheless useful for many kinds of plan analysis. The XML form of showplan has more detail than the graphical representation, but even that is a shallow depiction of the code that actually runs inside SQL Server when a query is executed.
It is easy to be seduced into thinking that what we see as an ‘execution plan’ is more complete than it actually is. As a tool for high-level analysis, it is excellent, but do not make the mistake of taking it too literally. More detail on this later. One more thing to appreciate before we get into a concrete example: the SQL Server engine contains a component known as the Expression Service. This is used by components such as the query optimizer, query execution, and the storage engine to perform computations, conversions and comparisons.
It is the call to the expression service in the execution plan that can be deferred and performed by a plan operator other than the source Compute Scalar (or other expression-defining operator).
An Example
I came across a forum thread that demonstrated the concepts I want to explore in this post really well. The topic of discussion was delimited string-splitting (an old favourite of a topic, for sure) but I want to emphasise that the particular code is not at all important—it is the query plan execution I want to focus on.
The particular string-splitting method employed was one I first saw written about by Brad Shultz. It replaces the delimiters with XML tags, and then uses XML shredding to return the results. I should say that I am not a fan of this technique because it is (a) a strange use of XML; and (b) it does not work for all possible inputs. Anyway, I said the example was not that important in itself, so let’s get on to the first test:
Test 1: XML Split
DECLARE
    @ItemID bigint,
    @Item varchar(8000),
    @Input varchar(8000);

SET @Input = REPLICATE('a,b,c,d,e,f,g,h,i,j,k,l,m,n,o,p,q,r,s,t,u,v,w,x,y,z', 32);

SELECT
    @ItemID = ROW_NUMBER() OVER (ORDER BY @@SPID),
    @Item = x.i.value('./text()[1]', 'varchar(8000)')
FROM
(
    VALUES
        (
        CONVERT
            (xml,
            '<r>' +
            REPLACE(@Input, ',', '</r><r>') +
            '</r>', 0
            )
        )
) AS ToXML (result)
CROSS APPLY ToXML.result.nodes('./r') AS x(i);
The code above creates a single comma-delimited string containing the letters of the alphabet, repeated 32 times (a total string length of 1632 characters).
The string-splitting SELECT statement replaces the commas with XML tags, fixes up the start and end of the string, and then uses the nodes() XML method to perform the actual splitting. There is also a ROW_NUMBER call to number the elements returned in whatever order the nodes() method spits them out.
Finally, two variables are used to ‘eat’ the output so returning results to the client does not affect execution time. The execution plan is as follows:

The Constant Scan operator defines an expression labelled as [Expr1000] that performs the string replacement and conversion to the XML type.
There are four subsequent references to this expression in the query plan:
- Two XML Reader table-valued functions (performing the
nodes()shredding andvalue()functions) - The Filter operator (a start-up predicate checks that the expression is not
NULL) - The Stream Aggregate (as part of a
CASEexpression that determines what thevalue()XML method should finally return)
The query takes 3753ms to execute on my laptop. This seems a rather long time to shred a single string containing just 801 elements.
Test 2: Empty String
The following code makes one small modification to the test one script:
DECLARE
    @ItemID bigint,
    @Item varchar(8000),
    @Input varchar(8000);

SET @Input = REPLICATE('a,b,c,d,e,f,g,h,i,j,k,l,m,n,o,p,q,r,s,t,u,v,w,x,y,z', 32);

SELECT
    @ItemID = ROW_NUMBER() OVER (ORDER BY @@SPID),
    @Item = x.i.value('./text()[1]', 'varchar(8000)')
FROM
(
    VALUES
        (
        CONVERT
            (xml,
            '<r>' +
            REPLACE(@Input, ',', '</r><r>') +
            '</r>' +
            LEFT(@@DBTS, 0)  -- NEW
            , 0)
        )
) AS ToXML (result)
CROSS APPLY ToXML.result.nodes('./r') AS x(i);
The only difference in the execution plan is in the definition of [Expr1000]:

This plan returns the same correct results as the first test, but it completes in 8ms (quite an improvement over 3753ms).
Beyond the Execution Plan: Test 1
There is nothing in the query plan to explain why the second form of the query runs 500 times faster than the first.
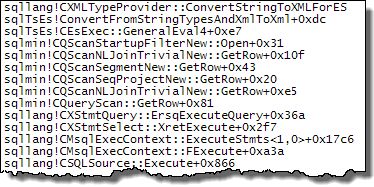
To see what is going on under the covers of the execution engine when executing the slow query, we can attach a debugger and look closer at the code SQL Server is really running. Using SQL Server 2012 (or later) and setting a breakpoint on the CXMLTypeProvider::ConvertStringToXMLForES method (as the name suggests, it converts a string to XML for the Expression Service) the first debugger break occurs with this stack trace:

I know that not everyone reading this post will routinely analyze stack traces, so for this first example I will describe the interesting calls from the bottom up (the currently executing code is on top, each line below is the method that called that routine):
- There is nothing very interesting below
CQueryScan::GetRow(it is just start-up code). CQueryScan:GetRowdrives the plan as we are used to seeing it. You might think of it as approximately the code behind the greenSELECTquery plan icon in a graphical plan. It reads a row at a time from the first plan operator to its right.- The first visible plan operator to execute is the leftmost Nested Loops Join (
CQScanNLJoinTrivialNew::GetRow). (The Compute Scalar to its left in the graphical plan simply defines an alias for an expression computed by the Stream Aggregate—it does not even exist in the code executed by the execution engine). - The Nested Loops Join operator asks the Sequence Project operator for a row (
CQScanSeqProjectNew::GetRow). - The Sequence Project operator asks the Segment operator for a row (
CQScanSegmentNew::GetRow). - The Segment operator asks the second Nested Loops Join for a row (
CQScanNLJoinTrivialNew::GetRow). - The Nested Loops Join has obtained a row from the Constant Scan and is now preparing to fetch a row from the inner side of the join.
- The start-up Filter operator is executing its
Open()method (CQScanStartupFilterNew::Open) - The start-up Filter calls into the general entry point for the Expression Service (ES) to evaluate expression
[Expr1000]defined by the Constant Scan. CEsExec::GeneralEval4calls an ES method to convert a string to XML (ConvertFromStringTypesAndXmlToXml).- The XML type provider executes the code that actually converts the string to XML (
ConvertStringToXMLForES).
The stack trace illustrates two things nicely:
- The iterative nature of plan operators (one row at a time,
Open,GetRow, andClosemethods) - An expression defined by one operator (the Constant Scan) being deferred for evaluation until a later operator (the start-up Filter) requires the result
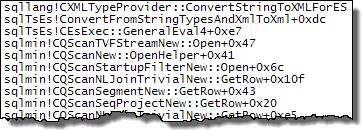
Continuing execution with the debugger, the next break occurs when the Table-Valued Function to the right of the Filter is initialised:

Another break when the Table-valued Function on the lowest branch of the plan initialises:

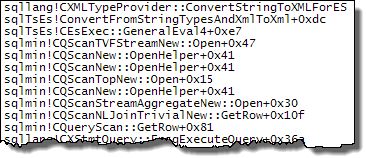
And finally, a break from the Stream Aggregate, when it needs to evaluate [Expr1016] (which contains a reference to [Expr1000]):

The last two breaks (lowest Table-Valued Function and Stream Aggregate) execute a total of 801 times.
The reason for the slow performance of this query is now clear: [Expr1000] is being computed more than 1604 times. Yes, that means the REPLACE and CONVERT to XML really does run 1604 times on the same string value—no wonder performance is so poor!
If you are inclined to test it, the expression service method that performs the REPLACE is sqlTsEs!BhReplaceBhStrStr. It turns out that the string REPLACE is very much faster than conversion to XML (remember XML is a LOB type and also has complex validation rules) so the dominant performance effect is the conversion to XML.
Beyond the Execution Plan: Test 2
Running test two with the debugger attached reveals that only one call is made to CXMLTypeProvider::ConvertStringToXMLForES:

Reading down the stack trace we see that execution of the plan (as we know it) has not started yet. The call to convert the string to XML is called from InitForExecute() and SetupQueryScanAndExpression.
The conversion to XML is evaluated once and cached in the execution context (CQueryExecContext::FillExprCache). Once the iterative part of plan execution begins, the cached result can be retrieved directly without calling ConvertStringToXMLForES() 1604 times.
Test 3: Column Reference
Before anyone goes off adding LEFT(@@DBTS, 0) to all their expressions (!) look what happens when we use a table to hold the input data rather than a variable:
DECLARE
    @ItemID bigint,
    @Item varchar(8000);

DECLARE @Table AS table
(
    Input varchar(8000) NOT NULL
);

INSERT @Table (Input)
VALUES (REPLICATE('a,b,c,d,e,f,g,h,i,j,k,l,m,n,o,p,q,r,s,t,u,v,w,x,y,z', 32));

SELECT
    @ItemID = ROW_NUMBER() OVER (ORDER BY @@SPID),
    @Item = x.i.value('./text()[1]', 'varchar(8000)')
FROM @Table AS t
CROSS APPLY
(
    VALUES
        (
        CONVERT
            (xml,
            '<r>' +
            REPLACE(t.Input, ',', '</r><r>') +
            '</r>' +
            LEFT(@@DBTS, 0)
            , 0)
        )
) AS ToXML (result)
CROSS APPLY ToXML.result.nodes('./r') AS x(i);
Instead of the Constant Scan we saw when using a variable, we now have a Table Scan and a Compute Scalar that defines the expression:
[Expr1003] = Scalar Operator(CONVERT(xml,''+
replace(@Table.[Input] as [t].[Input],',',' ')+
' '+ substring(CONVERT_IMPLICIT(varchar(8),@@dbts,0),(1),(0)),0))
The other plan details are the same as before. The expression label [Expr1003] is still referenced by the Filter, two Table-Valued Functions and the Stream Aggregate.
The test 3 query takes 3758ms to complete.
Debugger analysis shows that CXMLTypeProvider::ConvertStringToXMLForES is again being called directly by the Filter, Table-Valued Functions, and Stream Aggregate.
Test 4: CRYPT_GEN_RANDOM
This final test replaces @@DBTS with the CRYPT_GEN_RANDOM function:
DECLARE
    @ItemID bigint,
    @Item varchar(8000);

DECLARE @Table AS table
(
    Input varchar(8000) NOT NULL
);

INSERT @Table (Input)
VALUES (REPLICATE('a,b,c,d,e,f,g,h,i,j,k,l,m,n,o,p,q,r,s,t,u,v,w,x,y,z', 32));

SELECT
    @ItemID = ROW_NUMBER() OVER (ORDER BY @@SPID),
    @Item = x.i.value('./text()[1]', 'varchar(8000)')
FROM @Table AS t
CROSS APPLY
(
    VALUES
        (
        CONVERT
            (xml,
            '<r>' +
            REPLACE(t.Input, ',', '</r><r>') +
            '</r>' +
            LEFT(CRYPT_GEN_RANDOM(1), 0)    -- CHANGED
            , 0)
        )
) AS ToXML (result)
CROSS APPLY ToXML.result.nodes('./r') AS x(i);
The execution plan shows an extra Compute Scalar next to the Table Scan:
[Expr1018] = Scalar Operator(''+replace(@Table.[Input] as [t].[Input],',',' ')+' ')The Compute Scalar to the left of that is the same one seen previously, though it now references the new expression in its definition:
[Expr1003] = Scalar Operator( CONVERT(xml,[Expr1018]+
substring(CONVERT_IMPLICIT(varchar(8000),Crypt_Gen_Random((1)),0),(1),(0)),0))
The remainder of the query plan is unaffected. The same operators reference [Expr1003] as before. As you might have been expecting, this query executes in 8ms again.
Explanation
In test 1, there is nothing to stop the query processor deferring execution of the expression, which results in the same expensive computation being performed 1604 times (once each for the Filter and first Table-Valued Function, and 801 times each for the second Function and the Stream Aggregate).
As an interesting aside, notice that even with OPTION (RECOMPILE) specified, constant-folding only applies to the REPLACE and string concatenation; constant-folding cannot produce a LOB type (including XML).
In test 2, we introduced the non-deterministic function @@DBTS. This is one of the functions (like RAND and GETDATE) that are implemented to always return the same value per instance per query (despite being non-deterministic, see the links in the Further Reading section below for more details).
These runtime constants are evaluated before the query starts processing rows and the result is cached. There are some hints (ConstExpr labels) in the execution plan that may indicate a runtime constant but I have not found this to be fully reliable.
In test 3, we changed the game again by replacing the reference to a variable with a column reference from a table. The value of this column reference could change for each table row so the engine can no longer treat the expression as a runtime constant. As a consequence, the result is no longer cached and we see the same behaviour (and slow performance) as in test one.
In test 4, we replaced the @@DBTS function with the side-effecting function CRYPT_GEN_RANDOM (another such function is NEWID). One of the effects of this is to disable the deferred evaluation of the expression defined by the Compute Scalar.
The result is a XML LOB and a second optimization occurs where handles to the same LOB (evaluated by the defining operator) can be shared by other operators that reference the LOB. This combination of effects means the expensive computation is only performed once in test four, even though the runtime constant caching mechanism is not used.
Final Thoughts
- There is a lot more going on in query execution than we can see in execution plans.
- In general, there are no guarantees about the order of execution of expressions, or how many times each will be evaluated.
- Please do not start using
@@DBTSorCRYPT_GEN_RANDOMfor their undocumented effects. - It might be nice if showplan output did indicate if a computation was deferred or cached, but it is not there today.
- In many cases we can work around the potential for poor performance caused by repeated evaluation by explicitly materializing the result of the expression using a variable, table, non-inline function…though not always.
- Please do not suggest improvements to the XML string splitter unless it handles all input characters and can accept a semicolon as a delimiter.
- I prefer to use SQLCLR for string splitting, prior to the availability of the
STRING_SPLITfunction introduced in SQL Server 2016. NoteSTRING_SPLITwas inexplicably implemented without an ordinal column and remained that way until SQL Server 2022.
Acknowledgements
I would like to particularly thank Usman Butt and Chris Morris from SQL Server Central for their contributions and thoughts which helped me write this entry.
Further Reading
- When a Function is indeed a Constant by Andrew Kelly (archive link).
- Runtime Constant Functions by Conor Cunningham.
- RAND() and other runtime constant functions by Conor Cunningham.
- Scalar Operator Costing by Conor Cunningham.
