Temporary Table Caching in Stored Procedures

Introduction
Ask anyone what the primary advantage of temporary tables over table variables is, and the chances are they will say that temporary tables support statistics and table variables do not.
This is true, of course. The indexes that enforce PRIMARY KEY and UNIQUE constraints on table variables do not have populated statistics associated with them. Neither do any non-constraint table variable indexes (using inline index definitions, available starting with SQL Server 2014). Finally, it is not possible to manually create statistics on table variables.
Intuitively, then, any query that has alternative execution plans to choose from ought to benefit from using a temporary table rather than a table variable. This is also true, up to a point.
Stored Procedures and Optimization
The most common use of temporary tables is in stored procedures, where they can be very useful as a way of simplifying a large query into smaller parts.
This gives the optimizer a better chance of finding good execution plans, by providing statistical information about intermediate result sets, and probably makes future maintenance of the procedure easier as well.
In case it is not obvious, breaking a complex query into smaller steps using temporary tables makes life easier for the optimizer in several ways:
- Smaller queries tend to have a smaller number of possible execution plans, reducing the chances that the optimizer will miss a good one.
- Complex queries are less likely to have good cardinality (row count) estimates and other statistical information, since small errors tend to grow quickly as more and more operators appear in the plan.
This is a very important point that is not widely appreciated. The SQL Server query optimizer is only as good as the information it has to work with.
If cardinality or distribution information is badly wrong at any point in the plan, the result will most likely be a poor execution plan selection from that point forward.
It is not just a matter of creating and maintaining appropriate statistics on the base tables, either. The optimizer does use these as a starting point, but it also derives new statistics at every plan operator, and things can quickly conspire to make these (invisible) derived statistics hopelessly wrong.
The only real sign that something is wrong (aside from poor performance) is that actual row counts vary widely from the optimizer’s estimate.
SQL Server does not make it easy today to routinely collect and analyse differences between cardinality estimates and runtime row counts, though some small (but welcome) steps forward have been made, for example with new row count information in sys.dm_exec_query_stats.
The benefits of using simplifying temporary tables where necessary are potentially better execution plans — now and in the future, as data distribution changes and new execution plans are compiled.
On the cost side of the ledger, we have the extra effort needed to populate the temporary table, and maintain statistics. In addition, we expect a higher number of recompilations for optimality reasons due to changes in statistics.
In short, we have a trade-off between potential execution plan quality and maintenance/recompilation cost.
The problem, though, is that temporary tables do not work quite how (almost) everyone expects them to…
A World Without Temporary Objects
Imagine if temporary tables and table variables did not exist, and we had a complex query with cardinality-estimation difficulties that would be best addressed by breaking the query into parts.
The example presented below is necessarily simplified, using the AdventureWorks sample database to make it accessible.
It is not a query with insurmountable optimization problems by any means, but bear with me.
IF OBJECT_ID(N'dbo.Demo', N'P') IS NOT NULL
BEGIN
    DROP PROCEDURE dbo.Demo;
END;
GO
CREATE PROCEDURE dbo.Demo
    @StartsWith nvarchar(50)
AS
BEGIN
    SET NOCOUNT ON;

    SELECT
        P.[Name],
        OrderCount = COUNT_BIG(DISTINCT TH.ReferenceOrderID)
    FROM Production.Product AS P
    JOIN Production.TransactionHistory AS TH
        ON TH.ProductID = P.ProductID
    WHERE
        P.[Name] LIKE @StartsWith + N'%'
    GROUP BY
        P.[Name];
END;
GO
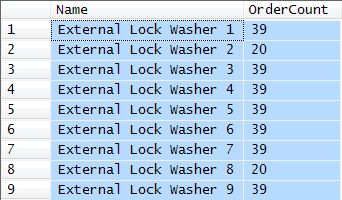
This procedure returns a count of orders containing a part whose name starts with the string passed in as a parameter. For example:
DBCC FREEPROCCACHE;

EXECUTE dbo.Demo
    @StartsWith = N'E';
Typical results are shown below:
A Short Digression about Parameter Sniffing
The only real optimization issue in this simplified example is parameter-sniffing. The number of rows that match the LIKE predicate varies widely depending on the value of the @StartsWith parameter, which can impact execution plan selection.
When the SELECT query is compiled or recompiled, SQL Server uses the actual value of the parameter to estimate the number of rows qualified from the Product table. If the SELECT statement happens to compile or recompile with a parameter that matches very few rows (or none), we get an execution plan like this:
DBCC FREEPROCCACHE;

EXECUTE dbo.Demo
    @StartsWith = N'[0-9]';
This plan is cached and reused next time the procedure is called, perhaps with a parameter value that matches more rows than before, but not enough to cause an automatic recompilation:
EXECUTE dbo.Demo
    @StartsWith = N'M';
The post-execution plan is:

This results in a large number of Key Lookups and a Sort that spills to tempdb physical disk. The memory grant for the sort was sized for the expected 370 rows, not the 22,527 that actually turned up.
If you are curious about the Constant Scan and Compute Scalar operators in these plans, see my previous post Dynamic Seeks and Hidden Implicit Conversions for details.
One way (certainly not the only way) to address this parameter-sniffing problem is to ask SQL Server to compile a fresh query plan for the SELECT statement on every execution, using the OPTION (RECOMPILE) query hint:
ALTER PROCEDURE dbo.Demo
    @StartsWith nvarchar(50)
AS
BEGIN
    SET NOCOUNT ON;

    SELECT
        P.[Name],
        OrderCount = COUNT_BIG(DISTINCT TH.ReferenceOrderID)
    FROM Production.Product AS P
    JOIN Production.TransactionHistory AS TH
        ON TH.ProductID = P.ProductID
    WHERE
        P.[Name] LIKE @StartsWith + N'%'
    GROUP BY
        P.[Name]
    OPTION (RECOMPILE); -- New!
END;
GO
This gives us plans optimized for the particular parameter value at runtime, and the added bonus of embedding the runtime value of the parameter is into the query so the dynamic seek is no longer required.
For more details on parameter embedding, see my article, Parameter Sniffing, Embedding, and the RECOMPILE Options.
EXECUTE dbo.Demo
    @StartsWith = N'[0-9]';
With recompile, the execution plan is:

And:
EXECUTE dbo.Demo
    @StartsWith = N'M';
Gives us:

Back to the Main Example
Imagine that the example query is much more complex than shown, and we decide to break it into two parts:
- Fetch qualified items from the
Productstable - Join the results (with statistics) to the
TransactionHistorytable.
Using a permanent table
Remember that temporary objects do not exist for this part of the discussion, so we have to use a permanent table:
ALTER PROCEDURE dbo.Demo
    @StartsWith nvarchar(50)
AS
BEGIN
    SET NOCOUNT ON;

    -- Real table to hold intermediate result
    CREATE TABLE dbo.Temp
    (
        ProductID integer NOT NULL,
        [Name] nvarchar(50) COLLATE DATABASE_DEFAULT NOT NULL
    );

    -- First part of the 'complex' query
    INSERT dbo.Temp
        (ProductID, [Name])
    SELECT
        P.ProductID,
        P.[Name]
    FROM Production.Product AS P
    WHERE
        P.[Name] LIKE @StartsWith + N'%';

    -- Second part referencing the 'temp' table
    SELECT
        T.[Name],
        OrderCount = COUNT_BIG(DISTINCT TH.ReferenceOrderID)
    FROM dbo.Temp AS T
    JOIN Production.TransactionHistory AS TH
        ON TH.ProductID = T.ProductID
    GROUP BY
        T.[Name];

    -- Show the statistics for the Name column
    DBCC SHOW_STATISTICS (Temp, Name) WITH STAT_HEADER, HISTOGRAM;

    DROP TABLE dbo.Temp;
END;
GO
Expectations
This procedure is not very practical as it stands, because the CREATE TABLE and DROP TABLE statements would make it impossible for more than one user to execute it at the same time. Nevertheless, it does show how most people expect things to work regarding statistics, temporary table lifetimes, and compilation:
DBCC FREEPROCCACHE;

EXECUTE dbo.Demo
    @StartsWith = N'A';
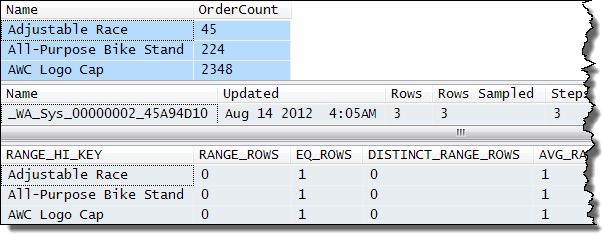
There are three matching Product records, shown below together with the DBCC SHOW_STATISTICS output:
There is nothing too surprising in the execution plans:
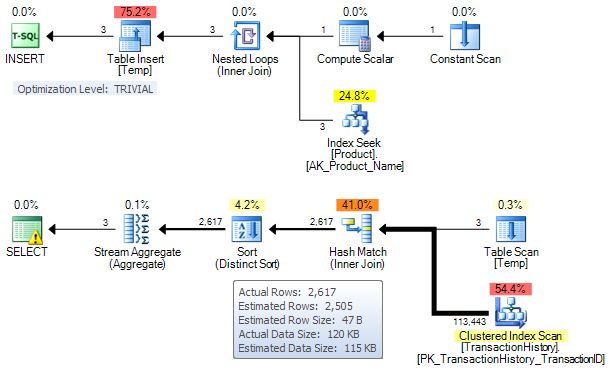
The table INSERT is a trivial plan (no cost-based choices for the optimizer). The SELECT query has cardinality estimates that are very close to the actual numbers encountered. The warning triangle on the SELECT is just suggesting an index for the TransactionHistory table, which we won’t be adding on this occasion.
While the procedure was executing, a Profiler trace captured the following compilation and statistics activity:
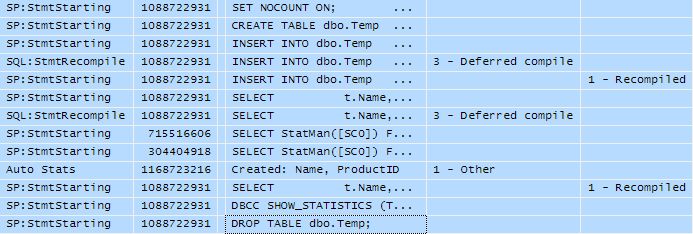
The table is created, and since this is the first time the procedure has been run, the INSERT and SELECT statements both incur a deferred compilation.
As part of the SELECT compilation, new statistics are created on the Name and ProductID columns of the new table. The DBCC SHOW_STATISTICS command executes, and finally the table is dropped.
Second execution
Now we execute the procedure again but for products that start with ‘E’ rather than ‘A’:
EXECUTE dbo.Demo
    @StartsWith = N'E';
The matching records and statistics are shown below:
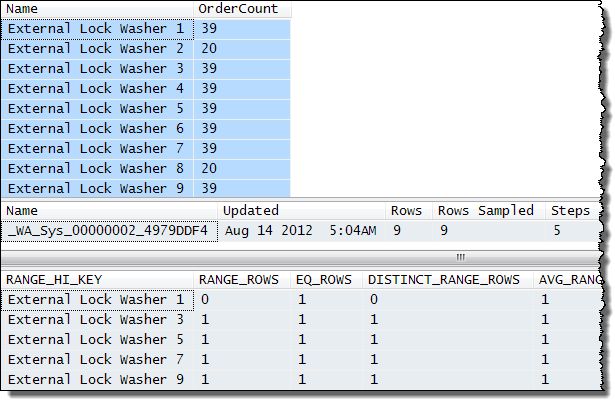
This time there are nine matching records, summarized in five histogram steps. The execution plan is (trivial INSERT plan not repeated):

Again, the cardinality estimates are extremely good, and the optimizer selected a nested loops plus key-lookup plan based on costs computed according to the smaller number of expected rows. The Profiler trace captured the following:
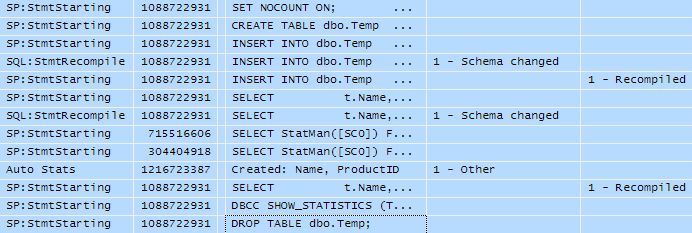
The only change is that this time recompilation is triggered because the cached INSERT and SELECT plans reference a table that no longer exists, leading to a schema changed recompilation.
The crucial observations here are that the table is recreated and new statistics are gathered on every execution.
This is the way most people expect tables, statistics, and compilations to behave inside stored procedures, so don’t worry if there’s nothing too surprising so far.
Using a Temporary Table
As mentioned, the previous example is not terribly practical. It is possible to conjure up schemes where ordinary tables can serve the purpose effectively, but as it stands, our procedure would likely cause runtime errors if more than one user or process attempted to execute it concurrently. In addition, ordinary tables do not benefit from internal optimizations that only apply to genuine temporary tables, so they tend to be less efficient, even if created in tempdb.
We now return to the real world (where temporary tables do exist) and modify the procedure to use a temporary table instead of a permanent table:
ALTER PROCEDURE dbo.Demo
    @StartsWith nvarchar(50)
AS
BEGIN
    SET NOCOUNT ON;

    CREATE TABLE #Temp
    (
        ProductID integer NOT NULL,
        [Name] nvarchar(50) COLLATE DATABASE_DEFAULT NOT NULL
    );

    INSERT INTO #Temp
        (ProductID, [Name])
    SELECT
        P.ProductID,
        P.[Name]
    FROM Production.Product AS P
    WHERE
        P.[Name] LIKE @StartsWith + N'%';

    SELECT
        T.[Name],
        OrderCount = COUNT_BIG(DISTINCT TH.ReferenceOrderID)
    FROM #Temp AS T
    JOIN Production.TransactionHistory AS TH
        ON TH.ProductID = T.ProductID
    GROUP BY
        T.[Name];

    DBCC SHOW_STATISTICS (N'tempdb..#Temp', [Name])
        WITH STAT_HEADER, HISTOGRAM;

    DROP TABLE #Temp;
END;
GO
Executing this procedure with an ‘E’ parameter produces exactly the same output as when the permanent table was used. Same execution plan, same statistics, same Profiler output, everything:
DBCC FREEPROCCACHE;

EXECUTE dbo.Demo
    @StartsWith = N'E';
Now we execute the procedure with a parameter value of ‘T’, which has 65 matching records in the Product table.
EXECUTE dbo.Demo
    @StartsWith = N'T';
This is the output (only the first nine of the 65 matching names are shown in the first result set):
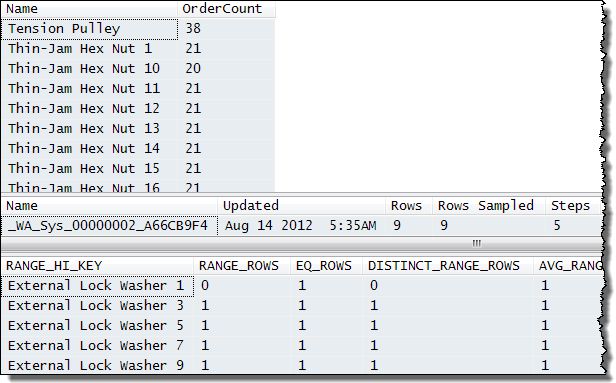
The output rows are as expected (products that begin with ‘T’) but the SHOW_STATISTICS output is for data starting with ‘E’—statistics from the previous execution!
The execution plan has serious cardinality estimation errors:

It has the same nested loops and key-lookup shape and estimated row counts as the ‘E’ execution, instead of being optimized for the ‘T’ data. This causes slow performance and a sort that spills data to physical tempdb disk.
The Profiler output explains why: no recompilations occurred, and no statistics were created.

In fact, with the AdventureWorks database, there is no way to persist a different execution plan or update the statistics for this procedure without changing it (more on that later). Even executing with [A-Z] as the parameter reuses the plan optimized for the ‘E’ value:
EXECUTE dbo.Demo
    @StartsWith = N'[A-Z]';
The Key Lookup is now executed 113,443 times, and the Sort has to perform a multi-pass spill to tempdb (previously only a single pass spill was required).
Executing the procedure with the WITH RECOMPILE option will produce better plans—at the cost of recompiling the whole procedure—and the resulting plans will not be cached for reuse. In general, recompiling the whole procedure every time could be bad since many procedures have many more statements to recompile than just a single INSERT and SELECT.
Although we have not yet identified a cause for the behaviour we are seeing, perhaps the answer lies in adding a RECOMPILE query hint to the SELECT statement as we did earlier for the parameter-sniffing example?
OPTION (RECOMPILE) to the Rescue?
Thinking that the cause might be a form of the parameter-sniffing problem, we now modify the procedure to add the RECOMPILE query hint to just the SELECT statement. This avoids recompiling the whole procedure on each call as EXECUTE … WITH RECOMPILE would do, and will hopefully solve our optimization problems:
ALTER PROCEDURE dbo.Demo
    @StartsWith nvarchar(50)
AS
BEGIN
    SET NOCOUNT ON;

    CREATE TABLE #Temp
    (
        ProductID integer NOT NULL,
        [Name] nvarchar(50) COLLATE DATABASE_DEFAULT NOT NULL
    );

    INSERT INTO #Temp
        (ProductID, [Name])
    SELECT
        P.ProductID,
        P.[Name]
    FROM Production.Product AS P
    WHERE
        P.[Name] LIKE @StartsWith + N'%';

    SELECT
        T.[Name],
        OrderCount = COUNT_BIG(DISTINCT TH.ReferenceOrderID)
    FROM #Temp AS T
    JOIN Production.TransactionHistory AS TH
        ON TH.ProductID = T.ProductID
    GROUP BY
        T.[Name]
    OPTION (RECOMPILE);

    DBCC SHOW_STATISTICS (N'tempdb..#Temp', Name)
        WITH STAT_HEADER, HISTOGRAM;

    DROP TABLE #Temp;
END;
GO
Unsurprisingly, clearing the plan cache and executing with a parameter value of ‘E’ produces the exact same nested loops and key lookup plan as previously shown (and the same statistics and Profiler events too).
DBCC FREEPROCCACHE;

EXECUTE dbo.Demo
    @StartsWith = N'E';
This is fine because it is the optimal plan for this value. The test for OPTION (RECOMPILE) comes when we try a second execution with the 65-row ‘T’ value:
EXECUTE dbo.Demo
    @StartsWith = N'T';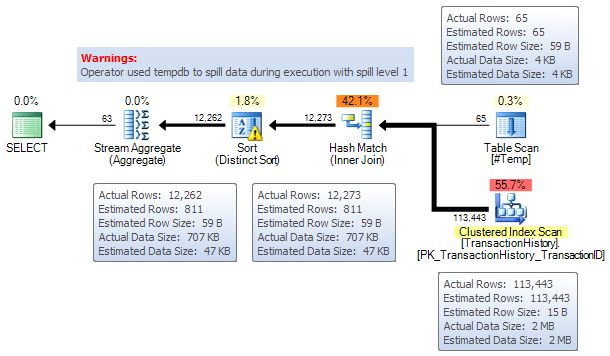
The execution plan has a different shape now, with the optimizer correctly preferring a Hash join over the Nested Loops plus Key Lookup. The estimated cardinality is correct for the temporary table (65 rows versus 9 previously seen for ‘E’), but it is badly wrong for the hash join (811 rows expected, 12,273 actual) and the Distinct Sort, which has to perform a single-pass spill to tempdb disk.
The procedure output shows the reason for the inaccuracy:
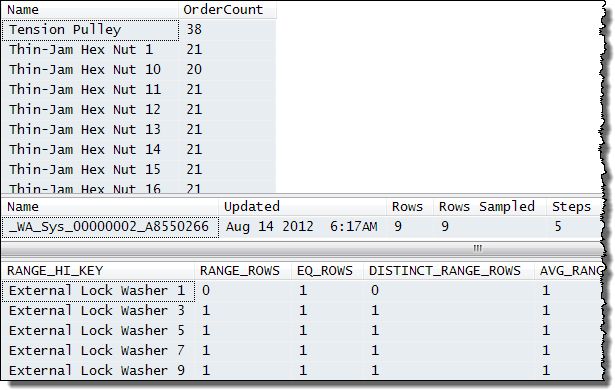
The results are correct of course (65 products starting with ‘T’) but the statistics are again still reflecting the parameter value ‘E’.
The RECOMPILE query hint allows the optimizer to see the true cardinality of the temporary table (65 rows) but the 100% wrong statistics on the ProductID column used to estimate the cardinality of the join to the TransactionHistory table result in a mess of a plan from that point forward.
Note that statistics on the Name column are also considered interesting by the optimizer for this query due to the GROUP BY clause. The SHOW_STATISTICS output above shows the Name statistics because it more immediately shows that ‘E’ values are stored; the ProductID statistics are integers, and so harder for the reader to correlate with the parameter.
The Profiler output confirms the recompilation due to the query hint, and that no statistics were created or updated:

An interesting thing occurs if we execute the procedure four more times with the same ‘T’ parameter (a total of five times with ‘T’):
EXECUTE dbo.Demo
    @StartsWith = N'T';
EXECUTE dbo.Demo
    @StartsWith = N'T';
EXECUTE dbo.Demo
    @StartsWith = N'T';
EXECUTE dbo.Demo
    @StartsWith = N'T';
The first three of those executions are exactly as before. The fourth one suddenly produces this different execution plan:
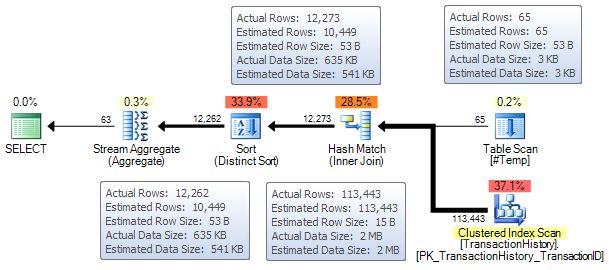
The estimates are now well within the boundaries of expected accuracy, and the Sort now receives enough workspace memory to avoid spilling rows to tempdb. The procedure output shows that statistics have been updated, now showing 65 rows that start with ‘T’ sampled (in 49 histogram steps):
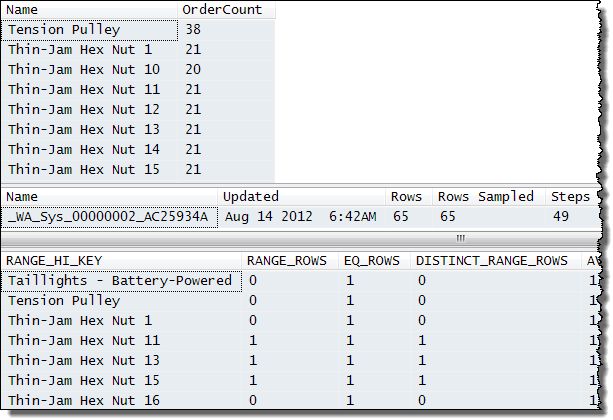
This is confirmed by the Profiler trace output:

Notice the StatMan and AutoStats entries showing the ProductID and Name column statistics being updated. Unfortunately, executing the procedure again with a new (different) parameter value takes us back to inaccurate cardinality estimates again.
The execution plans for this procedure aren’t always a disaster, but this is pure luck—poor estimates are poor estimates, whether the query plan happens to perform acceptably or not. We really need to get to the root cause here. Perhaps OPTION (RECOMPILE) was not the way to go, and we should try a manual statistics update instead of relying on automatic statistics updates?
Manual Statistics Update to the Rescue?
We know we want to add an UPDATE STATISTICS command to our stored procedure instead of the OPTION (RECOMPILE) … but where to put the new statement exactly?
The statistics we want to update are created during compilation or recompilation of the SELECT statement, suggesting the UPDATE STATISTICS should come after the SELECT; but then how could it possibly affect the preceding SELECT plan? It seems the only sensible place to put it is before the SELECT, however counter-intuitive that might seem:
ALTER PROCEDURE dbo.Demo
    @StartsWith nvarchar(50)
AS
BEGIN
    SET NOCOUNT ON;

    CREATE TABLE #Temp
    (
        ProductID integer NOT NULL,
        [Name] nvarchar(50) COLLATE DATABASE_DEFAULT NOT NULL
    );

    INSERT INTO #Temp
        (ProductID, [Name])
    SELECT
        P.ProductID,
        P.[Name]
    FROM Production.Product AS P
    WHERE
        P.[Name] LIKE @StartsWith + N'%';

    -- New!
    UPDATE STATISTICS #Temp;

    SELECT
        T.[Name],
        OrderCount = COUNT_BIG(DISTINCT TH.ReferenceOrderID)
    FROM #Temp AS T
    JOIN Production.TransactionHistory AS TH
        ON TH.ProductID = T.ProductID
    GROUP BY
        T.[Name];

    DBCC SHOW_STATISTICS (N'tempdb..#Temp', Name)
        WITH STAT_HEADER, HISTOGRAM;

    DROP TABLE #Temp;
END;
GO
Following the same pattern as before, we clear the plan cache (though this isn’t strictly necessary since the ALTER PROCEDURE invalidates cached plans anyway) then execute with ‘E’ and ‘T’ parameters as before:
DBCC FREEPROCCACHE;

EXECUTE dbo.Demo
    @StartsWith = N'E';

EXECUTE dbo.Demo
    @StartsWith = N'T';
The results for the ‘E’ execution are the same as always, so here are just the results for the ‘T’ execution:
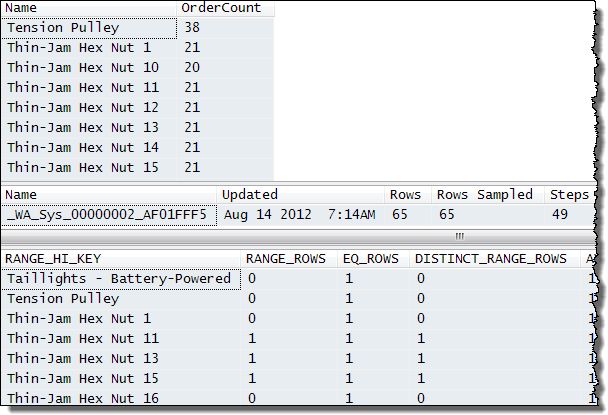
The above output looks very promising. Correct results and the statistics have been updated to reflect the ‘T’ parameter. The Profiler trace output shows the statistics updates too—but no recompilation:

The execution plan is a disaster:
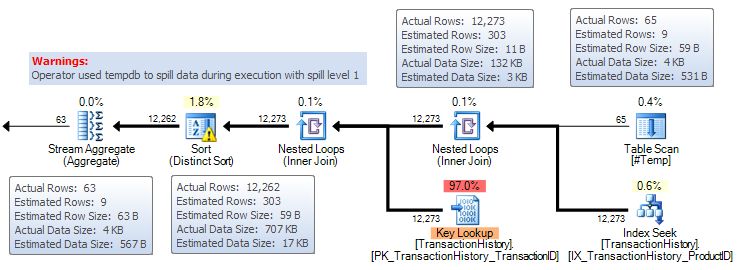
The estimated number of rows in the temporary table is 9 (the number of rows the ‘E’ execution produced not the 65 actually present), and everything is wrong from that point forward, including the Sort spilling to tempdb again.
The UPDATE STATISTICS command did its job, but the cached query plan did not recompile—though we might expect that it should, right?
As with the first temporary table example (no RECOMPILE or UPDATE STATISTICS), this plan is stuck in cache, given the size of the AdventureWorks database. No parameter value will cause a recompilation, and every subsequent execution will use the ‘E’ plan.
This is very reminiscent of the parameter-sniffing problem we encountered earlier, though the SELECT query in question has no direct parameter value to be sniffed!
In a final effort to produce reliable plans, our last attempt will be to combine both OPTION (RECOMPILE) and UPDATE STATISTICS…
RECOMPILE and UPDATE STATISTICS to the Rescue?
Our stored procedure now includes an UPDATE STATISTICS before the SELECT, and an OPTION (RECOMPILE) query hint on the SELECT itself:
ALTER PROCEDURE dbo.Demo
    @StartsWith nvarchar(50)
AS
BEGIN
    SET NOCOUNT ON;

    CREATE TABLE #Temp
    (
        ProductID integer NOT NULL,
        [Name] nvarchar(50) COLLATE DATABASE_DEFAULT NOT NULL
    );

    INSERT #Temp
        (ProductID, [Name])
    SELECT
        P.ProductID,
        P.[Name]
    FROM Production.Product AS P
    WHERE
        P.[Name] LIKE @StartsWith + N'%';

    UPDATE STATISTICS #Temp;

    SELECT
        T.[Name],
        OrderCount = COUNT_BIG(DISTINCT TH.ReferenceOrderID)
    FROM #Temp AS T
    JOIN Production.TransactionHistory AS TH
        ON TH.ProductID = T.ProductID
    GROUP BY
        T.Name
    OPTION (RECOMPILE);

    DBCC SHOW_STATISTICS (N'tempdb..#Temp', [Name])
        WITH STAT_HEADER, HISTOGRAM;

    DROP TABLE #Temp;
END;
GO
Our usual ‘E’ and ‘T’ test executions:
DBCC FREEPROCCACHE;

EXECUTE dbo.Demo
    @StartsWith = N'E';

EXECUTE dbo.Demo
    @StartsWith = N'T';
The first ‘E’ execution performs as it always has, with correct statistics and an optimal query plan. The results for ‘T’ are:
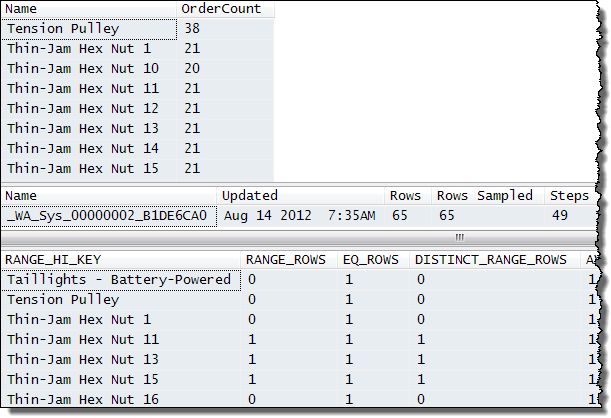
The output is correct, and so are the statistics: 65 rows sampled, stored in 49 histogram steps. The execution plan for the ‘T’ run is:
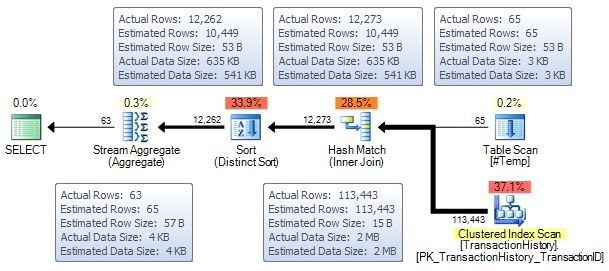
Success!
All estimates are very good, the Sort is performed in memory, and the query executes quickly. Further experimentation with other parameter values shows that new statistics are always generated, and the SELECT query plan always recompiles to use those statistics.
If you are concerned by the small discrepancy after the Hash Join (estimate 10,449 rows; actual 12,273) don’t be. Cardinality estimation is a tough problem— try using the statistics histograms yourself to predict how the ProductID values in the temporary table (65 rows in 49 steps, remember) will join to the histogram on the same column for the much larger TransactionHistory table. You’ll find the task of matching values to values using RANGE_ROWS, EQ_ROWS and so on is really not an easy one at all.
Enter the Table Variable…
The final option we are going to look at is using a table variable instead of a temporary table:
ALTER PROCEDURE dbo.Demo
    @StartsWith nvarchar(50)
AS
BEGIN
    SET NOCOUNT ON;

    DECLARE @Temp AS table
    (
        ProductID integer NOT NULL,
        [Name] nvarchar(50) NOT NULL
    );

    INSERT @Temp
        (ProductID, [Name])
    SELECT
        P.ProductID,
        P.[Name]
    FROM Production.Product AS P
    WHERE
        P.[Name] LIKE @StartsWith + N'%';

    SELECT
        T.[Name],
        OrderCount = COUNT_BIG(DISTINCT TH.ReferenceOrderID)
    FROM @Temp AS T
    JOIN Production.TransactionHistory AS TH
        ON TH.ProductID = T.ProductID
    GROUP BY
        T.[Name]
    OPTION (RECOMPILE);

END;
GO
There are a few small changes to the procedure here:
- The
COLLATEclause is no longer necessary in the definition of theNamecolumn, since the default for table variables is the collation of the context database anyway (the default for temporary tables is the collation of tempdb). - There is no need (or option) to drop the table at the end of the procedure — table variables simply go out of scope.
- There is no
DBCC SHOW_STATISTICSstatement either, since table variables do not support statistics at all.
The first execution with a parameter value of ‘E’ produces this execution plan and trace output:
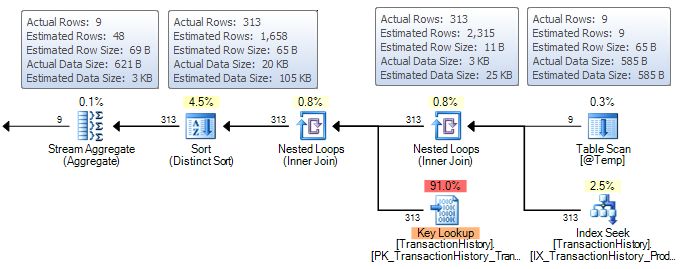

The OPTION (RECOMPILE) on the SELECT statement ensures that the cardinality estimate for the table variable is exactly right, but the lack of statistics means the optimizer resorts to guesses after that point. The guessed estimates turn out to be higher than the actual number of rows, so no performance problems result, although the Sort is allocated more memory than it needs. The trace output is a bit smaller than before, since no statistics are created.
The second test is with a parameter value of ‘T’:
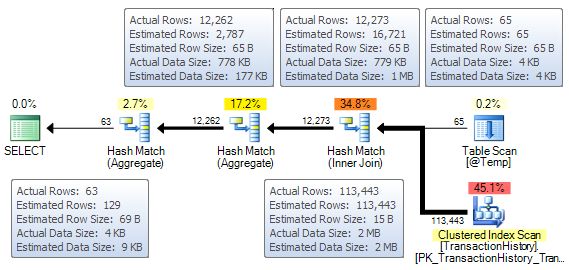
Again, the number of rows in the table variable is exactly right due to the statement-level RECOMPILE, and the later guesswork also turns out to work quite well. The overall shape of the plan is quite different for this parameter value (hash joins versus nested loops for example). There is one cardinality estimation problem at the middle hash operator, but whether it causes performance problems or not depends on your version of SQL Server.
To make the issue clearer, we will perform one final test, a parameter value of ‘[A-Z]’, qualifying all 504 products:
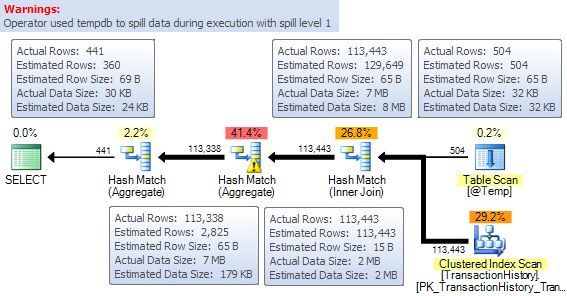
Once more, the table variable cardinality is exactly right (504 rows). Both inputs to the hash join look exactly right, and the guessed output from that join is also very close to the actual. The lack of statistical information makes itself felt at the middle hash operator though; the optimizer has no idea how many distinct values there might be for the combination (Name, OrderID), so it guesses at 2,825. This guess is very much smaller than the 113,338 actual, and the hash table spills out to tempdb physical disk as a result.
The table variable implementation happens to produce reasonable plans in some cases, based on the sniffed table cardinality provided by OPTION (RECOMPILE), but the lack of statistics leads to wild guesses and potential performance issues further up the tree. It’s interesting that one of the main perceived benefits of table variables— fewer recompilations— has to be abandoned in order to produce semi-reasonable plans. This follows hard on the heels of our seeing the main benefit of temporary tables —statistics— being 100% wrong earlier!
The last thing I want to mention about table variables is that for all their limitations, they do something else temporary tables cannot. A join from a table variable is estimated for the average case summed over all rows. This is similar to hinting OPTIMIZE FOR UNKNOWN for a temporary table query with a parameter, but the average-case estimation occurs for all joined rows, not just one predicate, and of course there is no parameter variable in a join for OPTIMIZE FOR UNKNOWN to work on anyway.
Question Time
At this point, you should have some questions:
- Why does the temporary table behave so differently from the permanent table?
- Do you really have to
UPDATE STATISTICSbefore they are created, and addOPTION (RECOMPILE)when you use temporary tables this way? - Why does the
RECOMPILEquery hint only produce the desired effect with temporary tables every so often?
Part of the answer to these questions lies with the caching of temporary tables first introduced to SQL Server in the 2005 version. (This information continues to be accurate all the way to and including SQL Server 2022).
CREATE and DROP, Don’t
I will talk about this in much more detail in my next post, Temporary Table Caching Explained, but the key point is that CREATE TABLE and DROP TABLE do not create and drop temporary tables in a stored procedure, if the temporary object can be cached. The temporary object is renamed to an internal form when DROP TABLE is executed, and renamed back to the same user-visible name when the corresponding CREATE TABLE is encountered on the next execution. In addition, any statistics that were auto-created on the temporary table are also cached. This means that statistics from a previous execution remain when the procedure is next called.
The following code demonstrates the object_id of a temporary table remaining the same between executions (there is a more comprehensive demonstration in the follow-up post):
ALTER PROCEDURE dbo.Demo
AS
BEGIN
    CREATE TABLE #Temp (col1 integer NULL);

    SELECT ObjectID =
        OBJECT_ID(N'tempdb..#Temp');

    DROP TABLE #Temp;
END;
GO
EXECUTE dbo.Demo;
EXECUTE dbo.Demo;
EXECUTE dbo.Demo;
GO
Example output:
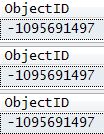
This is very different from the case where we used a permanent table. With a permanent table, CREATE and DROP definitely do create and drop a table on each execution of the procedure. The table is new each time, new statistics are created, and new plans are compiled on each execution.
The permanent table behaviour is probably more intuitive than the apparently strange behaviour of cached temporary tables, but it does allow temporary tables an opportunity to cache plans and temporary objects for reuse, which is not possible when using a permanent table in the way we did.
Recompilation Thresholds
You might be familiar with the concept of Recompilation Thresholds, as described in the Plan Caching and Recompilation in SQL Server 2012 Microsoft Technical Article. To recap briefly:
- Cached query plans include a Recompilation Threshold (RT) for statistics considered interesting by the optimizer while compiling the plan.
- The query plan also records the cardinality of tables and indexed views referenced by the plan, at the time the plan is compiled. (I demonstrated how to determine which statistics are considered ‘interesting’ by the optimizer during compilation in my previous post How to Find the Statistics Used to Compile an Execution Plan).
- Generally, if the column modification counter (
colmodctr) for interesting statistics change by RT or more, the query recompiles. - Similarly, if the table cardinality has changed by RT or more compared with the value stored at the time the cached plan was created, the query plan also recompiles.
- The value of RT depends on the type of table (permanent or temporary) and the number of rows (
n) in the table or indexed view at the time of compilation.
The following summary of RT values is taken from the Technical Article mentioned just above:
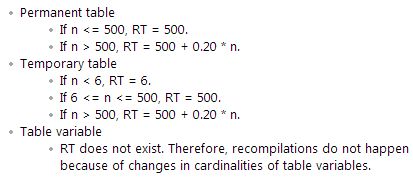
There is another condition not listed above. If the table is empty at compilation time, RT is set to 1.
I say “generally” above because although queries referencing permanent tables recompile when interesting statistics modification counters change by RT or more, this is not the case for cached temporary tables in stored procedures, which only recompile when table cardinality changes by RT or more, unless OPTION (RECOMPILE) is used, when statistics counters come back into play.
If this sounds confusing, that’s because it is.
It might be a bug, but on the other hand, it does seem reasonable that a cached temporary table should not cause a recompilation simply because the procedure is called a number of times with the same parameter, with the number of modifications accumulating on each call to eventually pass RT.
In that specific case, we would probably prefer no recompilations. I filed a Connect item (archive link) to get the situation with statistics modification counters and temporary tables clarified, but it was closed as Won’t Fix:
The reasons for closing this bug is because the scenarios reported in the bug are not common enough and so unfortunately it does not meet the bar for the current release, also viable workaround is available and sent.
Anyway, in our experiments, the RT situation explains why the vanilla temporary table procedure (with no OPTION (RECOMPILE) or UPDATE STATISTICS) stuck with the same plan, while adding a RECOMPILE meant the plan would occasionally recompile (when accumulated changes passed RT). The vanilla procedure was initially called with a parameter value of ‘E’, which compiled a SELECT plan while 9 rows were in the temporary table.
Following the rules above for n=9, this means RT was set to 500, so the plan would recompile when n reached 9 + 500 = 509. The AdventureWorks Product table only contains 504 rows, so that target could not be reached, and the plan could never recompile. When OPTION (RECOMPILE) was added, the modification counters did accumulate to eventually pass RT.
The first execution was the same, with the ‘E’ parameter value resulting in 9 rows in the temporary table at compilation time, with RT = 509 as before. We then ran the procedure a total of five times with a parameter value of ‘T’. There happen to be 65 product names that start with ‘T’, so five executions resulted in 5 * 65 = 325 changes.
This does not reach the target of 509, but there is a second factor in play here. Although the temporary table is not dropped at the end of the procedure (just renamed), it is implicitly truncated (whether an explicit DROP TABLE is included in the procedure or not). This implicit truncation removes 65 rows on each execution, and this action adds to the modification counters.
On each ‘T’ execution then, 65 modifications are counted when the rows are added to the temporary table, and 65 more when the table is silently cleared at the end of the procedure. In total, the first four ‘T’ executions result in 65 * 2 * 4 = 520 modifications, which is enough to pass the 509 target.
That in itself is not enough to cause a recompilation though, because the RT test is performed as each query is retrieved from the plan cache for execution, and the final 65-row truncation happens at the end of the procedure, after the SELECT has already completed. On the next execution, whatever parameter is passed in, a recompilation will occur at the SELECT query.
The OPTION (RECOMPILE) version of the procedure is reproduced below:
ALTER PROCEDURE dbo.Demo
    @StartsWith nvarchar(50)
AS
BEGIN
    SET NOCOUNT ON;

    CREATE TABLE #Temp
    (
        ProductID integer NOT NULL,
        [Name] nvarchar(50) COLLATE DATABASE_DEFAULT NOT NULL
    );

    INSERT #Temp
        (ProductID, [Name])
    SELECT
        P.ProductID,
        P.[Name]
    FROM Production.Product AS P
    WHERE
        P.[Name] LIKE @StartsWith + N'%';

    SELECT
        T.[Name],
        OrderCount = COUNT_BIG(DISTINCT TH.ReferenceOrderID)
    FROM #Temp AS T
    JOIN Production.TransactionHistory AS TH
        ON TH.ProductID = T.ProductID
    GROUP BY
        T.[Name]
    OPTION (RECOMPILE);

    DBCC SHOW_STATISTICS (N'tempdb..#Temp', Name)
        WITH STAT_HEADER, HISTOGRAM;

    DROP TABLE #Temp;
END;
GO
Now run the tests as described above:
-- 9 rows, RT = 509
EXECUTE dbo.Demo
    @StartsWith = N'E';

-- 65 rows, 4 times = 260
-- Plus truncation modifications = 520
EXECUTE dbo.Demo
    @StartsWith = N'T';
EXECUTE dbo.Demo
    @StartsWith = N'T';
EXECUTE dbo.Demo
    @StartsWith = N'T';
EXECUTE dbo.Demo
    @StartsWith = N'T';

-- No rows, but plan still recompiled
EXECUTE dbo.Demo
    @StartsWith = N'5';
There are no products that start with ‘5’, but the 520 modifications already performed cause a recompilation anyway:
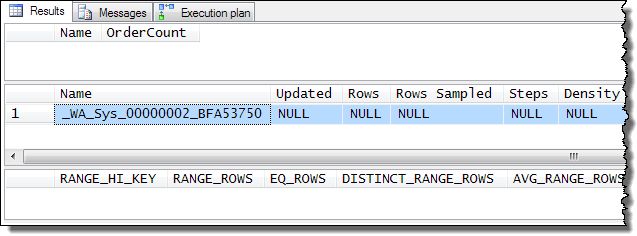
No results, and NULL statistics created! Luckily, the new RT value after this compilation is 1, so just one row is needed to produce a new plan. This is demonstrated by calling the same procedure again with a ‘K’ parameter value (just one product name starts with ‘K’):
EXECUTE dbo.Demo
    @StartsWith = N'K';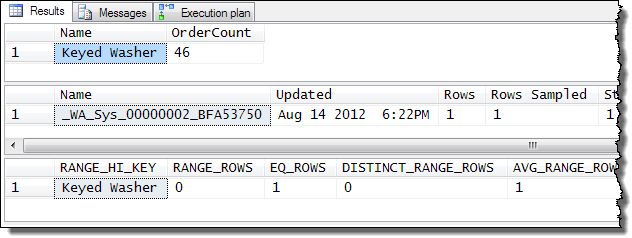
After this compilation, the new RT is 1 + 6 = 7, which can be confirmed by executing the procedure with a parameter value of ‘P’ (there are exactly seven Product rows where the name starts with ‘P’). And so on.
I should mention though, that it is just the carry-over of accumulated modifications that requires OPTION (RECOMPILE). Without this query hint, modifications are still accumulated within a single execution of the procedure (and may result in recompilation local to that single execution) but any accumulation is not carried over to the next procedure execution.
Statistics Updates
So far we have explained how the vanilla and OPTION (RECOMPILE) procedures produce the observed behaviour. The next configuration to look at is where OPTION (RECOMPILE) is not specified, but an UPDATE STATISTICS statement appears before the problematic SELECT query.
It should now be apparent that the placing of the UPDATE STATISTICS statement works because auto-created statistics from a previous execution are cached, and available for update by the next execution. The one remaining question is why the updated statistics do not cause a recompilation in our example. Remember we saw correct statistics, but the execution plan was not rebuilt to reflect the new information.
This is either a bug, or another example of different behaviour for cached temporary tables. In any case, the observed behaviour does not match that described in the Technical Article (the same diagram appears in the SQL Server Internals books from Microsoft Press):
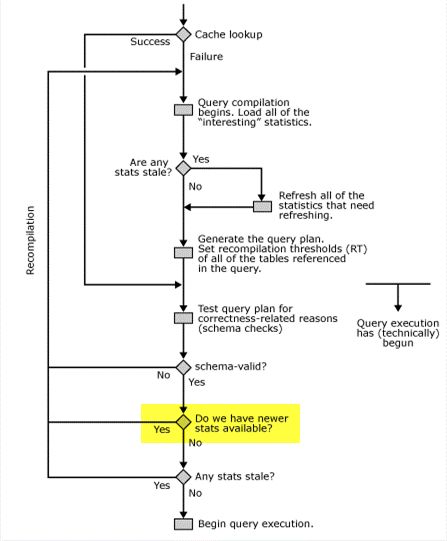
Whether this is a bug or undocumented designed behaviour (and it is the same on all versions of SQL Server from 2005 to 2022 inclusive) the effect is clear: UPDATE STATISTICS on a cached temporary table in a stored procedure is not enough on its own to force recompilation of a query plan. A recompilation may still occur for other reasons, for example if the cardinality of the table has changed by RT or more compared with the cardinality value stored with the cached plan.
This cannot happen with our UPDATE STATISTICS-only test procedure as shown earlier, since the first execution with the ‘E’ parameter value adds 9 rows to the temporary table, setting RT to 509, and the AdventureWorks Product table only has 504 rows in total. For the moment, at least, we may need to specify OPTION (RECOMPILE) as well as UPDATE STATISTICS if we want to be sure of a plan specific to the contents of a cached temporary table on each execution.
Summary
Temporary tables in stored procedures have a number of unexpected characteristics:
- Temporary objects may be cached across executions, despite explicit
CREATEandDROPstatements - Statistics associated with a cached temporary object are also cached
- Statistics may be 100% wrong compared with the current contents of a temporary table
- An implicit
TRUNCATE TABLEat the end of the procedure doubles the expected impact on column modification counters - It is possible to update cached statistics before the statement that caused them to be created
OPTION (RECOMPILE)changes the way column modifications are carried over between procedure calls- Manual
UPDATE STATISTICSis not enough to force a recompilation
It is possible that one or more of these behaviours is unintentional, but they have been this way for a very long time, and so are very unlikely to be changed.
Temporary tables behave quite similarly (aside from the UPDATE STATISTICS behaviour) to an in-procedure reference to a permanent table that was created outside the procedure.
It may be that some of the features of temporary tables shown in this article have their roots in a design that sought to mimic permanent table behaviours using non-sharable local temporary tables. On the other hand, it might be simply that the current arrangement provides the best chances for caching and reuse, and we are expected to take action where we suspect reusing the cached plan, temporary object, and/or statistics may not be optimal.
How likely you are to be affected by these issues depends on usage. A temporary table that contains wildly differing numbers of rows on every execution is unlikely to be affected. If the recompilation threshold is passed, chances are you will get good statistics and any cached plan with recompile without intervention.
For a plan cached when the temporary table contained 10,000 rows the default threshold is 500 + 0.2 * 10,000 = 2,500 rows. This means the next execution with more than 12,500 rows or fewer than 7,500 rows will pass the threshold test.
The formula to compute RT values is different when trace flag 2371 is enabled (or for versions and compatibility settings where the sublinear behaviour is default (if trace flag 9497 is off)). The new formula for RT is SQRT(1000 * table rows).
In principle, in later versions of SQL Server, we can look in the plan cache to check the cardinality of a temporary table and deduce the RT from there, but this is not convenient to do routinely. In practice, RT moves around a fair bit, so it can be hard to know how often a procedure might use stale cached statistics or a sub-optimal cached plan.
Final Thoughts
Avoiding temporary table caching removes the risk of stale statistics, but a cached plan may still be used unless the RECOMPILE query hint is used. Avoiding temporary table caching will also tend to increase contention on tempdb, and can be difficult to enforce in practice.
Procedures that routinely store relatively small result sets and use cached temporary tables are probably most at risk. This is quite a common scenario: temporary tables are often used for smaller sets (writing away large temporary tables is more difficult to justify).
One scenario that springs to mind is where a delimited string is passed as a parameter, split to a cached temporary table, which is then used to drive a more complex query. The plan for the complex query may be very sensitive to the cardinality and statistical distribution of values in the temporary table, so 100% wrong cached statistics and/or inappropriate plan reuse may be a problem. I’m sure there are many other scenarios.
It is quite ironic that the poor temporary table execution plans shown in this post are caused by the thing that is perceived to be their greatest strength—the availability of distribution statistics.
Some care is needed when choosing between table variables, temporary tables or another technique. The right choice in any particular circumstance will depend on many factors, only a few of which have been discussed here. Whichever option you choose, be sure to understand the choice you have made and the trade-offs that result.
There are also times where the best-performing solution will be to carefully craft one huge query, perhaps using hints and/or specific syntax tricks. This approach is perfectly valid but requires careful thought as future maintenance may be harder, and data changes over time may mean the carefully-designed manual execution plan gradually (or suddenly) becomes sub-optimal.
My general preference is still for simpler relational queries and, where necessary, for temporary tables over table variables as a starting point, but the details do indeed depend on the details.
Thanks for reading.
