Query Optimizer Deep Dive—Part 1

This is the first in a series of posts based on the content of the Query Optimizer Deep Dive presentations I have given over the last month or so at the Auckland SQL Users’ Group, and SQL Saturday events in Wellington, New Zealand and Adelaide, Australia.
Introduction
The motivation behind writing these sessions is finding that relatively few people have a good intuition for the way the optimizer works. This is partly because the official documentation is rather sparse, and partly because what information is available is dispersed across many books and blog posts.
The content presented here is very much geared to my preferred way of learning. It shows the concepts in what seems to me to be a reasonably logical sequence, and then provides tools to enable the interested reader to explore further, if desired.
When we write a query, we are not writing a computer program that can be directly executed. SQL is a declarative language used to logically describe the results we want to see.
SQL Server goes through a process of compilation and optimization to create a physically executable implementation of the stated logical requirement.
To put it another way, a SQL query is the specification for an executable program SQL Server writes for us. The SQL Server component responsible for finding an efficient physical execution plan for a given logical query requirement is the Query Optimizer.
The SQL Server Core Engine
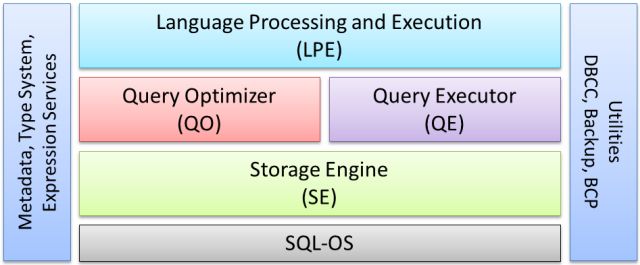
The diagram below shows conceptually where the Query Optimizer sits in the core SQL Server engine:

Language Processing is concerned with things like parsing the text of the query to make sure it is syntactically valid, binding table references to real database objects, deriving types for expressions, semantic analysis (for example checking that the query is not trying to execute a table), and binding GROUP BY references to the appropriate logical scope.
The Query Optimizer aims to find a good physical execution plan that matches the logical semantic of the query, and the Query Executor is responsible for running that plan to completion.
Below that, the Storage Engine provides access to physical storage, together with locking and transaction services. Finally, SQL-OS is the layer that provides threading, memory management, and scheduling services.
Using the same colours for the components shown above, a very high-level overview of query processing looks like this:

This series of blog posts is mostly concerned with the Optimize step above. It takes as its input a tree of logical operations produced by the previous stages.
Optimization Pipeline
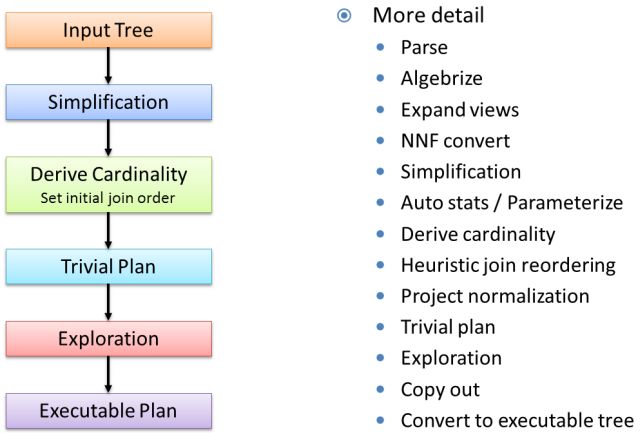
The diagram below shows the principal stages within query optimization, starting with the bound tree produced by the parser and algebrizer (now renamed the normalizer).
The coloured steps are the ones we will explore in depth. The right hand side of the diagram lists a bit more detail that I talk through when presenting this material live:

Input Tree
We start by looking at the bound logical tree (aka input tree). To make the discussion a little less abstract, we will use a test query issued against the AdventureWorks sample database.
This query shows products and the quantity in stock, limited to products with names that start with a letter between A and G:
-- Test query
SELECT
    P.[Name],
    Total = SUM(INV.Quantity)
FROM
    Production.Product AS P,
    Production.ProductInventory AS INV
WHERE
    INV.ProductID = P.ProductID
    AND P.[Name] LIKE N'[A-G]%'
GROUP BY
    P.[Name];
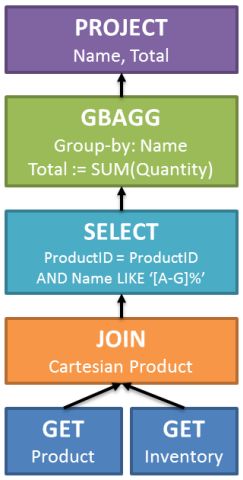
The input tree generated by this query is shown below, slightly simplified:

The operations in this tree are all purely logical, and have their roots in Relational Theory:
- The
GEToperation logically reads an entire table, though you should not yet be thinking in terms of physical operations such as a scan or a seek. - The
JOINis a cartesian product, logically joining every row in one table with every row in the other. - The
SELECTis not a SQL statement, it is a relational operation: filtering rows based on some condition (known as a predicate). Here, we are applying twoSELECToperations to filter on matching product IDs and rows where the product name starts with a letter between A and G. - The next logical operation is
GBAGG—a Group By Aggregate, an extension to the basic relational algebra that logically groups rows by some common attribute, and optionally computes an aggregate expression for each group. - Finally, we have a relational
PROJECToperation, which filters columns. We only need theNameandTotalcolumns, and those are the only two projected in the logical result set.
To see this tree directly, we can use undocumented trace flag 8605. This flag also requires the common trace flag 3604 to produce output to the SSMS messages window.
We can use another the QUERYTRACEON hint to set the trace flag just for this query:
-- Input tree (ISO-92 syntax)
SELECT
    P.[Name],
    Total = SUM(INV.Quantity)
FROM Production.Product AS P
JOIN Production.ProductInventory AS INV
    ON INV.ProductID = P.ProductID
WHERE
    P.[Name] LIKE N'[A-G]%'
GROUP BY
    P.[Name]
OPTION
(
    RECOMPILE,
    QUERYTRACEON 3604,
    QUERYTRACEON 8605
);
In the SSMS messages tab, we see a textual representation of the tree of logical operators I drew with coloured boxes before:
LogOp_Project QCOL: [P].Name COL: Expr1002
    LogOp_GbAgg OUT(QCOL: [P].Name,COL: Expr1002 ,) BY(QCOL: [P].Name,)
        LogOp_Project
            LogOp_Select
                LogOp_Join
                    LogOp_Get TBL: Production.Product(alias TBL: P)
                    LogOp_Get TBL: Production.ProductInventory(alias TBL: INV)
                    ScaOp_Comp x_cmpEq
                        ScaOp_Identifier QCOL: [INV].ProductID
                        ScaOp_Identifier QCOL: [P].ProductID
                ScaOp_Intrinsic like
                    ScaOp_Identifier QCOL: [P].Name
                    ScaOp_Const TI(nvarchar collate 872468488,Var,Trim,ML=12)
                    ScaOp_Const TI(nvarchar collate 872468488,Var,Trim,ML=2
                    ScaOp_Const TI(nvarchar collate 872468488,Null,Var,Trim,ML=12)
                    ScaOp_Const TI(nvarchar collate 872468488,Null,Var,Trim,ML=12)
                    ScaOp_Const TI(int,Null,ML=4) XVAR(int,Not Owned,Value=30)
            AncOp_PrjList
        AncOp_PrjList
            AncOp_PrjEl COL: Expr1002
                ScaOp_AggFunc stopSum Transformed
                    ScaOp_Identifier QCOL: [INV].Quantity
There are a few minor differences between this and the previous diagram. In particular, the expression computed by the aggregate is added by a separate projection (omitted for clarity before), and the SQL-92 join syntax means the join predicate is more tightly bound to the logical join.
Rewriting the query using SQL-89 join syntax highlights the second difference, producing a tree closer to the cartesian product followed by a relational SELECT:
-- Input tree (ISO-89)
SELECT
    P.[Name],
    Total = SUM(INV.Quantity)
FROM
    Production.Product AS P,
    Production.ProductInventory AS INV
WHERE
    INV.ProductID = P.ProductID
    AND P.[Name] LIKE N'[A-G]%'
GROUP BY
    P.[Name]
OPTION
(
    RECOMPILE,
    QUERYTRACEON 3604,
    QUERYTRACEON 8605
);
LogOp_Project QCOL: [P].Name COL: Expr1002
LogOp_GbAgg OUT(QCOL: [P].Name,COL: Expr1002 ,) BY(QCOL: [P].Name,)
LogOp_Project
LogOp_Select
LogOp_Join
LogOp_Get TBL: Production.Product(alias TBL: P)
LogOp_Get TBL: Production.ProductInventory(alias TBL: INV)
ScaOp_Const TI(bit,ML=1) XVAR(bit,Not Owned,Value=1)
ScaOp_Logical x_lopAnd
ScaOp_Comp x_cmpEq
ScaOp_Identifier QCOL: [INV].ProductID
ScaOp_Identifier QCOL: [P].ProductID
ScaOp_Intrinsic like
ScaOp_Identifier QCOL: [P].Name
ScaOp_Const TI(nvarchar collate 872468488,Var,Trim,ML=12)
ScaOp_Const TI(nvarchar collate 872468488,Var,Trim,ML=2)
ScaOp_Const TI(nvarchar collate 872468488,Null,Var,Trim,ML=12)
ScaOp_Const TI(nvarchar collate 872468488,Null,Var,Trim,ML=12)
ScaOp_Const TI(int,Null,ML=4) XVAR(int,Not Owned,Value=30)
AncOp_PrjList
AncOp_PrjList
AncOp_PrjEl COL: Expr1002
ScaOp_AggFunc stopSum Transformed
ScaOp_Identifier QCOL: [INV].QuantitySimplification
The first step of the optimization pipeline we will look at is simplification, where the optimizer looks to rewrite parts of the logical tree to remove redundancies and move logical operations around a bit to help later stages.
Major activities that occur around the time simplification occurs (I have taken a little artistic licence here to group a few separate stages together) include:
- Constant folding
- Domain simplification
- Predicate push-down
- Join simplification
- Contradiction detection
Constant folding is the process of evaluating an expression during optimization, rather than repeatedly at execution time.
In the following example, the complex expression in the WHERE clause can safely be evaluated early, resulting in WHERE p.Name LIKE ‘D%’:
SELECT
    P.[Name]
FROM Production.Product AS P
WHERE
    P.[Name] LIKE
        SUBSTRING(LEFT(CHAR(ASCII(CHAR(68))), 1) + '%', 1, 2);
Domain simplification enables the optimizer to reason about the range of valid values a column or expression can take.
In the next query, the only value for ProductID that logically matches all the predicates in the extended WHERE clause is the single value ‘400’.
The execution plan shows that simplification has reduced the three predicates to a single equality predicate, WHERE p.ProductID = 400:
SELECT TOP (10)
    P.*
FROM Production.Product AS P
WHERE
    P.ProductID BETWEEN 300 AND 400
    AND P.ProductID BETWEEN 200 AND 500
    AND P.ProductID BETWEEN 400 AND 600;
Predicate push-down involves pushing relational SELECTs (filtering rows based on a predicate) down the logical tree toward the leaves.
The heuristic here is that this is always a good thing to do (at least as far as expressions that reference a column are concerned) because it eliminates rows early, reducing the number of rows for later logical operations.
Moving SELECTs closer to the logical GETs (reading tables) also helps index and computed-column matching.
Join simplification allows the optimizer to remove unnecessary joins, convert logical outer joins to simpler inner joins where the NULLs introduced by the outer join are later rejected by another feature in the query, and remove provably empty subexpressions.
This is an incredibly powerful optimizer facility, with its roots again in relational theory. Rob Farley has written and presented about ways to use this feature effectively. In particular, he talks about how to write views to benefit from compile-time simplification, and avoid the views-on-views-on-views problem.
The following queries illustrate some of the join simplifications:
-- Complex example combining multiple simplifications
WITH Complex AS
(
    SELECT
        PC.ProductCategoryID, PC.Name AS CatName,
        PS.ProductSubcategoryID, PS.Name AS SubCatName,
        P.ProductID, P.Name AS ProductName,
        P.Color, P.ListPrice, P.ReorderPoint,
        PM.Name AS ModelName, PM.ModifiedDate
    FROM Production.ProductCategory AS PC
    FULL JOIN Production.ProductSubcategory AS PS
        ON PS.ProductCategoryID = PC.ProductCategoryID
    FULL JOIN Production.Product AS P
        ON P.ProductSubcategoryID = PS.ProductSubcategoryID
    FULL JOIN Production.ProductModel AS PM
        ON PM.ProductModelID = P.ProductModelID
)
SELECT
    C.ProductID,
    C.ProductName
FROM Complex AS C
WHERE
    C.ProductName LIKE N'G%';
That last example, with three full outer joins in a CTE (in-line view), simplifies down to a simple index seek on one table:

Cardinality Estimation
The optimizer only has direct information about table cardinality (total number of rows) for base tables. Statistics can provide additional histograms and frequency statistics, but again these are only maintained for base tables and indexed views.
To help the optimizer choose between competing strategies later on, it is essential to know how many rows are expected at each node in the logical tree, not just at GET leaf nodes. In addition, cardinality estimates above the leaves can be used to choose an initial join order (assuming the query contains several joins).
Cardinality estimation computes expected cardinality and distribution statistics for each plan node, working up from the leaves one node at a time. The logic used to create these derived estimates and statistics uses a model that makes certain assumptions about your data. For example, where the distribution of values is unknown, it is assumed to be uniform across the whole range of potential values.
You will generally get more accurate cardinality estimates if your queries fit the model, and, as with many things in the wider optimizer, simple and relational is best. Complex expressions, unusual or novel techniques, and using non-relational features often means cardinality estimation has to resort to (possibly educated) guessing.
Most of the choices made by the optimizer are driven by cardinality estimation, so if these are wrong, any good execution plans you might see are highly likely to be down to pure luck.
Trivial Plan
The next stage of the optimizer pipeline is Trivial Plan, which is a fast path to avoid the time and effort involved in full cost-based optimization, and only applies to logical query trees that have a clear and obvious ‘best’ execution plan.
The details of which types of query can benefit from Trivial Plan can change frequently, but things like joins, subqueries, and inequality predicates generally prevent this optimization.
The queries below show some examples where Trivial Plan can, and cannot be applied:
-- Trivial plan
SELECT
    P.ProductID
FROM Production.Product AS P
WHERE
    P.[Name] = N'Blade';
GO
-- Still trivial
SELECT
    P.[Name],
    RowNumber =
        ROW_NUMBER() OVER (
            ORDER BY P.[Name])
FROM Production.Product AS P
WHERE
    P.[Name] LIKE N'[A-G]%';
GO
-- 'Subquery' prevents a trivial plan
SELECT
    (SELECT P.ProductID)
FROM Production.Product AS P
WHERE
    P.[Name] = N'Blade';
GO
-- Inequality prevents a trivial plan
SELECT
    P.ProductID
FROM Production.Product AS P
WHERE
    P.[Name] <> N'Blade';
One interesting case where a Trivial Plan is not applied is where the estimated cost of the Trivial Plan query exceeds the configured cost threshold for parallelism.
The reasoning here is that any trivial plan that would qualify for a parallel plan suddenly presents a choice, and a choice means the query is no longer ‘trivial’, and we have to go through full cost-based optimization.
Taking this to the extreme, a SQL Server instance with the parallelism cost threshold set to zero will never produce a trivial plan (since all queries have a cost greater than zero). At the risk of stating the slightly obvious, note that a plan produced at this stage will always be serial. For experimentation only, the trivial plan stage can also be disabled using trace flag 8757.
You can check whether a query used a trivial plan or not by inspecting the Properties window in SSMS, and clicking on the root node of the graphical query plan. The ‘optimization level’ property will show ‘Trivial’ or ‘Full’ — the latter shows that a trip through cost-based optimization was required.
If a query results in a trivial plan, a physical execution plan is produced and the optimization process ends here.
