Forcing a Parallel Query Execution Plan

This article is for SQL Server professionals who have experienced the special kind of frustration that only comes from spending hours trying to convince the query optimizer to generate a parallel execution plan.
This situation often occurs when making an apparently innocuous change to the text of a moderately complex query—a change which somehow manages to turn a parallel plan that executes in ten seconds, into a five-minute serially-executing monster.
SQL Server provides a number of query and table hints that allow experienced users to take greater control over the final form of a query plan. These hints are usually seen as a tool of last resort, because they can make code harder to maintain, introduce extra dependencies, and may prevent the optimizer reacting to future changes in indexing or data distribution. One such query hint is OPTION (MAXDOP 1), which prevents the optimizer from considering plans that use parallelism. Sadly, there is currently no corresponding hint to force the optimizer to choose a parallel plan.
The result of all this is a great deal of wasted time trying increasingly obscure query syntax, until eventually the desired parallel plan is obtained, or the developer gives up in despair. Even where success is achieved, the price is often fragile code that risks reverting to serial execution any time the indexing or statistics change.
In any case, the resulting SQL is usually hard to read, and scary to maintain.
Why Expensive Queries Produce Serial Plans
Whenever the query optimizer produces a serial plan instead of the ‘obviously better’ parallel plan, there is always a reason.
Leaving aside the more trivial causes, such as the configuration setting max degree of parallelism being set to 1, running under a Resource Governor workload group with MAX_DOP = 1, or having only one logical processor available to SQL Server, the usual causes of a serial plan are parallelism-inhibiting operations, cardinality estimation errors, costing model limitations, and code path issues.
Parallelism-Inhibiting Components
There are many things that prevent parallelism, either because they make no sense in a parallel plan, or because SQL Server just does not support parallelism for them yet.
Some of these inhibitors force the whole plan to run serially, others require a ‘serial zone’ (a section of an execution plan forced to run on a single thread).
The list changes from version to version, but here are some things make the whole plan serial:
- Modifying the contents of a table variable (reading is fine)
- Any non-inline T-SQL scalar function
- CLR scalar functions marked as performing data access
- Certain intrinsic functions including
OBJECT_NAME,ENCYPTBYCERT, andIDENT_CURRENT - System table access (e.g. reading from
sys.tables)
Inconveniently, the list of intrinsic functions is quite long and does not seem to follow a pattern. ERROR_NUMBER and @@TRANCOUNT force a serial plan, while @@ERROR and @@NESTLEVEL do not, for example.
The T-SQL scalar function restriction has a subtlety. Any reference to a table (or view) with a computed column that uses a T-SQL scalar function will result in a serial plan, even if the problematic column is not referenced in the query.
I discuss an undocumented exception to the above in Properly Persisted Computed Columns for those people interested in more details.
Scalar UDF Inlining, new for SQL Server 2019, does not apply to scalar functions in computed columns, so that improvement will not directly re-enable parallelism for this case.
These query features are examples that require a serial zone in the plan (other areas of the plan may employ parallelism):
TOP- Row-mode sequence function (e.g.
ROW_NUMBER,RANK)- All cases before SQL Server 2012
- Sequence functions without a
PARTITION BYclause from 2012 onward
- Multi-statement T-SQL table-valued functions
- Backward (reverse key direction) range scans
- Row-mode global scalar aggregates
- Common sub-expression spools
- Recursive CTEs
The information presented above is based on an original list published by Craig Freedman.
One way to check that a query does not have any parallelism-inhibiting components is to test the query using a CPU cost multiplier. This should only be done on a private test system where you are able to flush the whole plan cache after testing. The idea is to use an undocumented and unsupported DBCC command to temporarily increase the CPU cost of the query plan operators. It is not a fool-proof test (some rare parallelizable queries will not generate a parallel plan with this technique) but it is nevertheless quite reliable:
USE AdventureWorks2012;
GO
-- Must be executed
DBCC FREEPROCCACHE;
DBCC SETCPUWEIGHT(1000);
GO
-- Query to test
-- Estimated execution plan is OK
SELECT
    COUNT_BIG(*)
FROM Production.Product AS P
LEFT JOIN Production.TransactionHistory AS TH
    ON TH.ProductID = P.ProductID
GO
-- Reset: must be executed
DBCC SETCPUWEIGHT(1);
DBCC FREEPROCCACHE;
The final commands to reset the CPU weighting factor and flush the plan cache are very important.
If you get a parallel estimated plan for a particular test query, it shows that a parallel plan is at least possible. Varying the value passed to the DBCC command adjusts the multiplier applied to normal CPU costs, so you will likely see different plans for different values. The illustrated factor of a thousand is often enough to produce a parallel estimated plan, but you may need to experiment with higher values.
It is not recommended to use estimated plans obtained using this technique directly in USE PLAN hints or plan guides because these are not necessarily plans the optimizer would consider naturally. To be clear: direct use of these plans might render a production system unsupported and unstable.
Cardinality Estimation Errors
If there is nothing that absolutely prevents parallelism in the target query, the optimizer may still choose a serial alternative if it has a lower estimated cost. For that reason, there are a couple of things we can do to promote the parallel option here, all based on the very sound notion of giving the optimizer accurate information to base its estimates on.
The considerations here go well beyond just ensuring statistics are up-to-date, or rebuilding them with the FULLSCAN option. For example, depending on the nature of the query, you may need to provide all or some of the following:
- Multi-column statistics (for correlations)
- Filtered statistics or indexes (for more histogram steps)
- Computed columns on filtering expressions in the query (to avoid cardinality guesses)
- Good constraint information (foreign keys and check constraints)
- Materialize parts of the query in temporary tables (more accurate statistics and estimates in complex plans)
- Regular hints such as
OPTIMIZE FOR
In general, anything you can do to ensure that estimated row counts are close to runtime values will help the optimizer cost the serial and parallel alternatives more accurately. Many failures to choose a parallel plan are caused by inaccurate row counts and average sizes.
Model Limitations
SQL Server uses a model to estimate the runtime cost of each operator in a query plan. The exact calculations vary between operators, but most are based on a minimum cost, with an additional per-row component.
None of these estimates of expected CPU and I/O cost directly account for the specific hardware SQL Server finds itself running on. The advantage of this is that plans from one machine can be readily reproduced and compared on another machine running the same version of the software, without having to worry about hardware differences.
Not all operators can be costed reasonably, and things like functions are particularly problematic because the optimizer has no clue how many rows might be produced or what the distribution of values might look like.
Even very normal-looking operators can pose problems. Consider the task of estimating the number of rows and distribution of values resulting from a join or a complex GROUP BY clause. Even where reasonable estimates can be made, the derived statistics that propagate up the query tree (from the persistent statistics at the leaves) tend to become unreliable quite quickly. The optimizer includes heuristics that aim to prevent these inaccuracies getting out of control, so it might resort to complete guesses after only a few operators, as the compounding effect of deriving new statistics takes hold.
There are many other assumptions and limitations of the model that will not fit into a blog post, the interested reader can find more detailed information in Chapter 8 of the indispensable SQL Server Internals books by Microsoft Press.
Costing Limitations
When SQL Server costs a parallel plan, it generally reduces the CPU cost for a parallel iterator by a factor equal to the expected runtime DOP (degree of parallelism).
For example the previous query can produce the following serial and parallel plans:
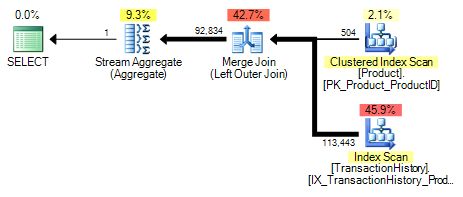

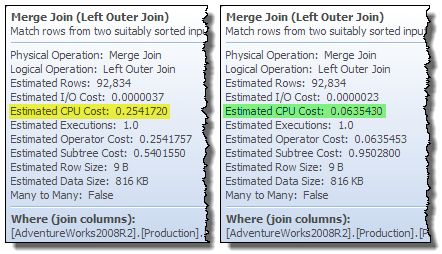
Taking the Merge Join operator as an example, the parallel version has its CPU cost reduced by a factor of 4 when the expected runtime DOP is four (serial plan on the left, parallel on the right):
On the other hand, the Index Scans show no reduction in I/O cost, though the CPU cost is again reduced by a factor of four:
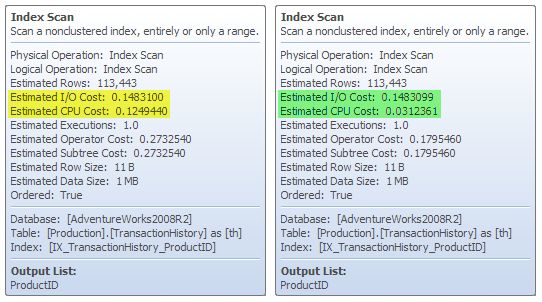
As mentioned earlier, different operators cost themselves differently (for example a many-to-many merge join also has an I/O cost component that also happens to be reduced by a factor of four). These details may also vary somewhat between releases, so the presentation here is to give you an appreciation of the general approach rather than to dwell too much on the specifics.
Looking again at the serial and parallel plans, it is clear that whichever plan costs cheaper depends on whether the parallel plan saves enough by reducing CPU and I/O costs in the various operators, to pay for the extra operators in the plan.
In this case, the extra operators are three exchange (Parallelism) operators: Two Repartition Streams to redistribute rows for correct results when joining, and one Gather Streams to merge the threads back to a single final result.
The way the numbers work means that it is often a tight race between the best parallel and serial plan alternatives. In many real-world cases, the difference between the two can be extremely small, which makes it all the more frustrating when the serial version turns out to take 50 times as long as the parallel version to execute.
One other point worth mentioning again here is that the DOP estimate is limited to the number of logical processors that SQL Server sees, divided by two. My test machine has eight cores, all available to SQL Server, but the DOP estimate used for costing calculations is limited to four. This has obvious consequences for costing, where CPU and I/O costs are typically divided by the estimated DOP of four, rather than eight.
A Note about Parallel Nested Loops
Plans with Nested Loops joins can be a particular problem, because the inner side almost always runs multiple threads serially. The parallelism icons are still present, but they indicate that there are DOP independent serial threads.
The distinction is a subtle one, but it explains why:
- Operators that normally force a serial zone can run ‘in parallel’ on the inner side of a loops join; and
- The optimizer does not reduce CPU costs on the inner side by the estimated runtime
DOP. This can put Nested Loops at an unfair disadvantage when it comes to parallelism costing, compared with Hash and Merge Joins.
Code Path Issues
This last category concerns the fact that the optimizer may not get as far as evaluating a parallel plan at all.
One way this can occur is if a final plan is found during the Trivial Plan stage. If a Trivial Plan is possible and the estimated plan cost is less than the configured cost threshold for parallelism, the cost-based optimization stages are skipped, and a serial plan is returned immediately.
Trivial Plan
The following query has an estimated serial plan cost of around 85 units. When the parallelism threshold is set to 100, a Trivial Plan is produced. You can see this by looking at the execution plan property Optimization Level, or by checking changes in sys.dm_exec_query_optimizer_info as shown below:
SELECT
    DEQOI.[counter],
    DEQOI.occurrence
FROM sys.dm_exec_query_optimizer_info AS DEQOI
WHERE
    [counter] IN ('trivial plan', 'search 0', 'search 1', 'search 2');
GO
SET SHOWPLAN_XML ON;
GO
SELECT
    COUNT_BIG(*)
FROM dbo.bigTransactionHistory AS BTH
OPTION (RECOMPILE);
GO
SET SHOWPLAN_XML OFF;
GO
SELECT
    DEQOI.[counter],
    DEQOI.occurrence
FROM sys.dm_exec_query_optimizer_info AS DEQOI
WHERE
    [counter] IN ('trivial plan', 'search 0', 'search 1', 'search 2');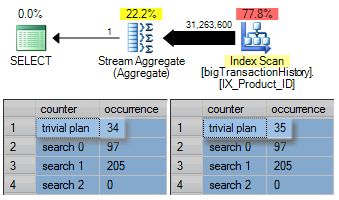
When the cost threshold for parallelism is reduced to 84 we get a parallel plan:
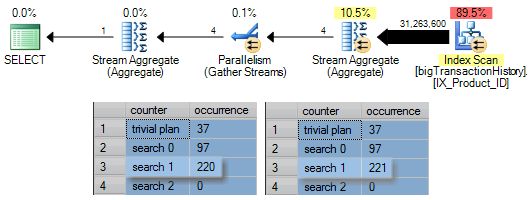
A deeper analysis shows that the query still qualified for Trivial Plan (and the stage was run), but the final cost exceeded the parallelism threshold so optimization continued with the cost-based stages.
This query does not qualify for search 0 (Transaction Processing) because a minimum of three tables are required for entry to that stage.
Optimization moves on to search 1 (Quick Plan) which runs twice. It runs first considering only serial plans, and comes out with a best cost of 84.6181.
Since this exceeds the threshold of 84, Quick Plan is re-run with the requirement to produce a parallel plan. The result is a parallel plan of cost 44.7854.
The plan does not meet the entry conditions (five table references) for search 2 (Full Optimization) so the finished plan is copied out.
Good Enough Plan & Time Out
Returning to code path reasons that prevent a parallel plan, the last category covers queries that enter the Quick Plan stage, but that stage terminates early, either with a Good Enough Plan Found message, or a Time Out. Both of these are heuristics to prevent the optimizer spending more time optimizing than it stands to gain by reducing estimated execution time (cost). Good Enough Plan results when the current lowest cost plan is so cheap that further optimization effort is no longer justified.
Time Out is a related phenomenon: At the start of a stage, the optimizer sets itself a ‘budget’ of a number of rule applications it estimates it can perform in the time justified by the initial cost of the plan. This means that query trees that start with a higher cost get a correspondingly larger allowance of rule applications (roughly analogous to the number of moves a chess program thinks ahead). If the optimizer explores the allowed number of rules before the natural end of the optimization stage, it returns the best complete plan at that point with a Time Out warning. This can occur during the first run of search 1 preventing us reaching the second run that requires parallelism.
As a side note, SQL Server 2019 and later are capable of producing parallel plans in search 0, but the feature remains hidden behind undocumented trace flag 11001 for the time being.
One interesting consequence of the rule concerning Trivial Plan and the cost threshold for parallelism is that a system configured with a cost threshold of zero can never produce a Trivial Plan. Bearing this in mind, we can generate a surprising Time Out with this AdventureWorks query:
SELECT * FROM Production.Product;As you would expect, this query is normally compiled at the Trivial Plan stage, since there are no real cost-based plan choices to make:
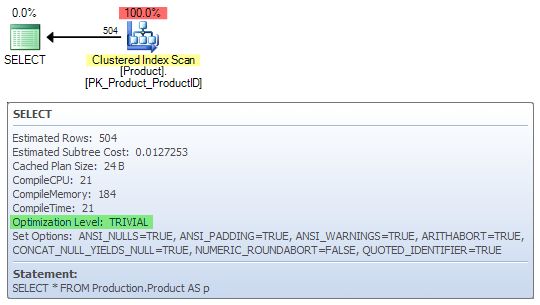
When the cost threshold is set to zero, we get Full Optimization with a Time Out warning: The optimizer timed out working out how to do SELECT * on a single small table!
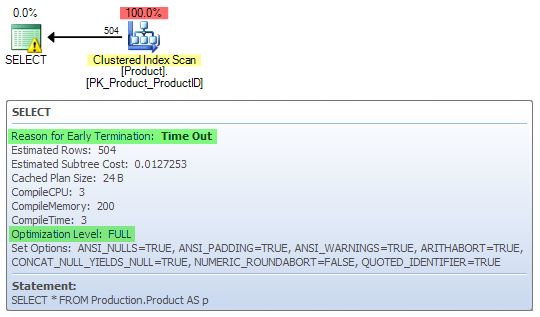
In this particular case, the optimizer ‘timed out’ after 15 tasks (it normally runs through many thousands). A Time Out result can sometimes also be an indicator that the input query is over-complex, but the interpretation is not always that straightforward.
A Solution
We need a robust query plan hint, analogous to MAXDOP, that we can specify as a last resort when all other techniques still result in a serial plan and the parallel alternative is much to be preferred.
I really want to emphasise that very many cases of unwanted serial plans are due to designers and developers not giving the optimizer good quality information. I see very few systems with things like proper multi-column statistics, filtered indexes/statistics, and adequate constraints. Even less frequently, do I see (perhaps non-persisted) computed columns created on query filter expressions to aid cardinality estimation.
On the other hand, non-relational database designs with poor indexing, and decidedly non-relational queries are extremely common. (As are database developers complaining about the poor decisions the optimizer makes sometimes!)
There’s always a trace flag
In the meantime, there is a workaround. It’s not perfect (and most certainly a choice of very last resort) but there is an undocumented trace flag that effectively lowers the parallelism entry cost threshold to zero for a particular query.
It actually goes a little further than that. For example, the following query will not generate a parallel plan even with a zero cost threshold:
SELECT TOP (1)
    P.[Name]
FROM Production.Product AS P
JOIN Production.TransactionHistory AS TH
    ON TH.ProductID = P.ProductID
ORDER BY
    P.[Name];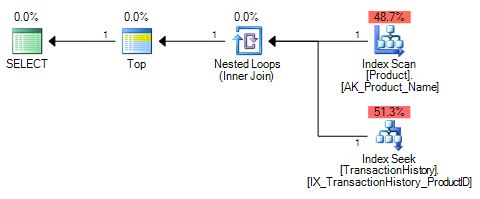
This is a completely trivial execution plan. The first row from the scan is joined to a single row from the seek. The total estimated cost of the serial plan is 0.0065893 units. Returning the cost threshold for parallelism to the default of 5 just for completeness, we can obtain a parallel plan using the trace flag:
SELECT TOP (1)
    P.[Name]
FROM Production.Product AS P
JOIN Production.TransactionHistory AS TH
    ON TH.ProductID = P.ProductID
ORDER BY
    P.[Name]
OPTION
(
    RECOMPILE,
    QUERYTRACEON 8649
);
The parallel alternative is returned, despite the fact it is costed much higher at 0.0349929 (5.3 times the cost of the serial plan).
This trace flag has proved invaluable to me in certain particularly tricky cases where a parallel plan is essential, but there is no reasonable way to get it from the optimizer otherwise.
Conclusion
Even experts with decades of SQL Server experience and detailed internal knowledge will want to be careful with this trace flag. I cannot recommend you use it directly in production unless advised by Microsoft, but you might like to use it on a test system as a last resort, perhaps to generate a plan guide or USE PLAN hint for use in production (after careful review).
This is an arguably lower risk strategy, but bear in mind that the parallel plans produced under this trace flag are not guaranteed to be ones the optimizer would normally consider. If you can improve the quality of information provided to the optimizer instead to get a parallel plan, go that way instead.
If you would prefer to see a fully supported T-SQL OPTION (MINDOP) or OPTION (PARALLEL_PLAN) hint, please vote for my Azure Feedback item Provide a hint to force generation of a parallel plan.
Updates
-
For SQL Server 2016 SP1 CU2 and later, there is a new undocumented query hint that performs the same function as trace flag 8649, but does not require administrator privileges:
OPTION (USE HINT ('ENABLE_PARALLEL_PLAN_PREFERENCE'));See this post by Erik Darling and this one by Dmitry Pilugin. It’s still undocumented, so please continue to vote on the feedback item.
-
In May 2020, Microsoft documented most of the
NonParallelPlanReasonreason codes.
