Myth: SQL Server Caches a Serial Plan with Every Parallel Plan

Introduction
Many people believe that whenever SQL Server creates an execution plan that uses parallelism, an alternative serial plan is also cached. The idea seems to be that the execution engine then decides between the parallel and serial alternatives at runtime. I’ve seen this on forums, in blogs, and even in books.
In fairness, a lot of the official documentation is not as clear as it might be on the subject. In this post, I will show that only a single (parallel) plan is cached. I will also show that SQL Server can execute a parallel plan on a single thread.
Before diving into the demonstration, I want to quickly run through some background information about the SQL Server plan cache.
Compiled Plans
Queries are expensive to compile and optimize, so SQL Server uses caching to improve efficiency through plan reuse. The server optimizes an entire batch all at once, and the result is known as a _compiled plan (_or sometimes ‘query plan’).
The dynamic management view sys.dm_exec_cached_plans contains one row for each compiled plan, with a plan_handle that uniquely identifies the compiled plan among those currently in cache (plan handles can be reused over time).
This plan handle can be passed to the dynamic management function sys.dm_exec_query_plan to show the compiled plan in XML format. When displayed in Management Studio, we can click on this XML representation to view the familiar graphical plan.
A compiled plan is a compile-time object—no user or runtime context is stored. You might find it helpful to think of the compiled plan as a template—or perhaps as being similar to the estimated execution plans seen in SQL Server Management Studio.
Execution Contexts
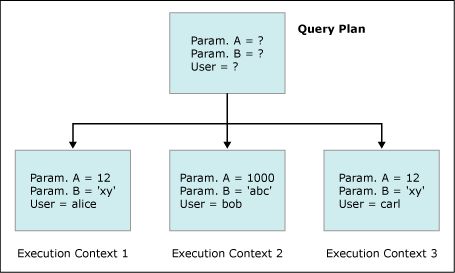
An execution context (or ‘executable plan’)—internally known as an MXC—is generated when a compiled plan is prepared for execution. Execution contexts contain specific runtime information, for a single execution, for a single user.
Thinking of the compiled plan as a template, an execution context is the concrete executable object derived by filling in run-time details like parameter values, local variables, details of objects created at runtime, and state information (for example, which statement within the batch is currently executing).
The following image, reproduced from the SQL Server Technical Article, Plan Caching and Recompilation in SQL Server 2012, shows the relationship:

If five users concurrently run the same batch, there might be a single compiled plan, but there will be five execution contexts containing runtime information, one for each of the separate executions. Execution contexts never exist without a parent compiled plan.
Execution contexts can be cached, but they are much cheaper to recreate than a compiled plan, which can only be regenerated by fully compiling a SQL query.
Execution contexts can be regenerated directly from the compiled plan. Cached execution contexts can be reinitialized with contextual information for a new user and runtime conditions.
You can find more information in the product documentation for Execution Plan Caching and Reuse. For those of you that want to explore the very deep internals of plan cache structures, there is an excellent blog entry by the SQL Server Programmability and API Development Team.
The Demonstration Script
As usual, I’m going to use a query against the AdventureWorks sample database, using SQL Server 2008 SP1 CU10 (build 10.0.2799).
The test rig I use in this post is best run on 2008 or later. It will execute on 2005, but there are important caveats to that, which I will cover later. It will not run correctly on Express Edition (any version).
DECLARE
    @PID integer,
    @Qty integer;

SELECT
    @PID = P.ProductID,
    @Qty = SUM(TH.Quantity)
FROM Production.Product AS P
JOIN Production.TransactionHistory AS TH
    ON TH.ProductID = P.ProductID
WHERE
    P.ProductID % 27 = 0
GROUP BY
    P.ProductID
ORDER BY
    SUM(TH.Quantity) ASC;
The query itself isn’t important — it doesn’t even produce any output thanks to the variable assignments.
The important thing is that it produces an interesting parallel plan, if we lower the cost threshold for parallelism a bit from the default:

This plan runs every iterator except the final sort on multiple threads, and includes a number of parallel-plan-only features.
There are three ‘exchanges’ (two Repartition Streams and one Gather Streams), and a bitmap. See Parallel Query Processing and Bitmap Showplan Operator in the product documentation for more information on exchanges and bitmaps.
Those of you that are very familiar with parallel plans might find it interesting that the Bitmap appears below a Merge Join—these are much more frequently seen in plans featuring a Hash Join (but I digress).
Environment
The first part of the test script sets the server max degree of parallelism option to zero, affinity mask to zero, and cost threshold for parallelism to 1.
These changes are to ensure that the optimizer produces a parallel plan for our test query.
-- =================
-- Environment Setup
-- =================

-- Connection settings
SET ANSI_NULLS, ANSI_PADDING, ANSI_WARNINGS,
    ARITHABORT, CONCAT_NULL_YIELDS_NULL,
    QUOTED_IDENTIFIER ON;
SET NUMERIC_ROUNDABORT OFF;
GO
USE AdventureWorks;
GO
-- Ensure advanced configuration options are available
EXECUTE sys.sp_configure
    @configname = 'show advanced options',
    @configvalue = 1;

-- Allow SQL Server to use all cores initially
EXECUTE sys.sp_configure
    @configname = 'affinity mask',
    @configvalue = 0;

-- Ensure server MAXDOP allows parallelism
EXECUTE sys.sp_configure
    @configname = 'max degree of parallelism',
    @configvalue = 0;

-- Reduce cost threshold for parallelism to make it easier
-- to produce a parallel plan
EXECUTE sys.sp_configure
    @configname = 'cost threshold for parallelism',
    @configvalue = 1;

-- Commit the configuration changes
RECONFIGURE;
GO
Procedures
The second part creates two stored procedures: one to run the test query, and one to show relevant information about the plan cache:
-- =================
-- Test objects
-- =================
IF OBJECT_ID(N'dbo.TestQuery', N'P') IS NOT NULL
    DROP PROCEDURE dbo.TestQuery;

IF OBJECT_ID(N'dbo.ShowPlanInfo', N'P') IS NOT NULL
    DROP PROCEDURE dbo.ShowPlanInfo;
GO
CREATE PROCEDURE dbo.TestQuery
AS
BEGIN
    SET NOCOUNT ON;

    DECLARE
        @PID INTEGER,
        @Qty INTEGER;

    SELECT
        @PID = P.ProductID,
        @Qty = SUM(TH.Quantity)
    FROM Production.Product P
    JOIN Production.TransactionHistory TH
        ON TH.ProductID = P.ProductID
    WHERE
        P.ProductID % 27 = 0
    GROUP BY
        P.ProductID
    ORDER BY
        SUM(TH.Quantity) ASC;
END;
GO
CREATE PROCEDURE dbo.ShowPlanInfo
AS
BEGIN
    SET NOCOUNT ON;

    SELECT
        cached_object_type = CP.cacheobjtype,
        plan_use_count = CP.usecounts,
        P.query_plan,
        source_text = TXT.[text],
        context_type = EC.cacheobjtype,
        context_use_count = EC.usecounts,
        ATTR.roundabort,
        ATTR.set_options,
        CP.plan_handle
    FROM sys.dm_exec_cached_plans AS CP
    CROSS APPLY sys.dm_exec_query_plan(CP.plan_handle) AS P
    CROSS APPLY sys.dm_exec_cached_plan_dependent_objects(CP.plan_handle) AS EC
    CROSS APPLY sys.dm_exec_sql_text(CP.plan_handle) AS TXT
    CROSS APPLY
    (
        SELECT
            roundabort = (CONVERT(integer, PVT.set_options) & 8192) / 8192,
            PVT.set_options
        FROM
        (
            SELECT
                DEPA.attribute,
                DEPA.[value]
            FROM sys.dm_exec_plan_attributes (CP.plan_handle) AS DEPA
        ) AS ATTR
        PIVOT
        (
                MAX([value])
                FOR attribute IN (set_options)
        ) AS PVT
    ) AS ATTR
    WHERE
        CP.cacheobjtype = N'Compiled Plan'
        AND CP.objtype = N'Proc'
        AND TXT.[text] LIKE N'%dbo.TestQuery%'
        AND TXT.[text] NOT LIKE N'%sys.dm_exec_cached_plans%';
END;
GO
The TestQuery stored procedure is a wrapper for the test SQL statement shown earlier.
The ShowPlanInfo stored procedure uses dynamic management views and functions to show the following information about plan cache objects:
| Item | Value |
|---|---|
cached_object_type |
Always ‘Compiled Plan’ for our test procedure |
plan_use_count |
The number of times the compiled plan has been used (or reused) |
query_plan |
The XML representation of the plan. Click on this in SSMS to show it in graphical form |
source_text |
The SQL batch that produced the plan (the CREATE PROCEDURE statement in our case) |
context_address |
The memory address of each execution context derived from the compiled plan |
context_type |
Always ‘Executable Plan’ (aka execution context) |
context_use_count |
The number of times the execution context has been reinitialized and reused |
roundabort |
The setting of the NUMERIC_ROUNDABORT connection used when creating the compiled plan |
plan_handle |
The compiled plan identifier (guaranteed to be unique per compiled plan in cache) |
The Tests
The third part of the script runs three tests:
- The test query with
affinity maskset to zero (parallel execution on all available logical CPUs) - The test query with
affinity maskset to one (execution on single logical CPU zero) - The test query after changing a connection
SEToption (to generate a new compiled plan)
-- =================
-- Tests
-- =================

-- Reset
CHECKPOINT;
DBCC DROPCLEANBUFFERS;
DBCC FREEPROCCACHE;
GO
-- Test 1: Parallel plan running on all available cores
EXECUTE dbo.TestQuery;
EXECUTE dbo.ShowPlanInfo;
GO
-- Set affinity mask to limit SQL Server to one core
EXECUTE sys.sp_configure
    @configname = 'affinity mask',
    @configvalue = 1;
RECONFIGURE;
GO
-- Test 2: Reusing the cached parallel plan, but running on a single scheduler
EXECUTE dbo.TestQuery;
EXECUTE dbo.ShowPlanInfo;
GO
-- Test 3:
-- Changing a SET option
SET NUMERIC_ROUNDABORT ON;
GO
EXECUTE TestQuery;
EXECUTE dbo.ShowPlanInfo;
GO
SET NUMERIC_ROUNDABORT OFF;
GO
Test 1 – Normal Parallel Execution
Running Test 1 with the SSMS option Include Actual Execution Plan on, produces the parallel plan shown previously:

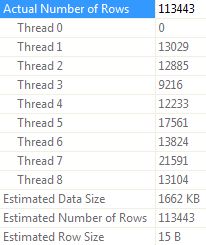
Selecting the connector running from the Clustered Index Scan to the Hash Match (Partial Aggregate), and looking in the SSMS Properties window, we see that this part of the plan executed on eight threads:

The XML version of the graphical show plan contains elements that confirm the parallel execution:


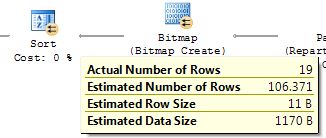
For reasons that will become apparent shortly, I also want to highlight the information shown for the line connecting the Bitmap iterator to the Sort:

The output from the plan information procedure is:

This shows a single cached compiled plan, with a single associated execution context.
Click on the XML query plan in SSMS to see the graphical representation of the compiled plan (notice the lack of any runtime information in a compiled plan).
Test 2 – Limited to a Single Logical CPU
Before running Test 2, the script sets the affinity mask to limit SQL Server to using a single execution unit. Prior to SQL Server 2005, changing this option required a service restart, but the change is now dynamically applied in all editions except Express Edition.
Importantly, unlike the max degree of parallelism and cost threshold for parallelism configuration options, changing the affinity mask does not clear the procedure cache. This allows the plan cached by Test 1 to be potentially reused by Test 2.
Running Test 2 (with actual execution plan on) we again get a parallel plan:

The first surprise, perhaps, is that we see a parallel plan at all—after all, we have limited SQL Server to a single CPU.
The little yellow circles are still there, as are the Exchange and Bitmap iterators.
Closer inspection reveals some important differences. Here’s the information shown in the SSMS Properties panel for the line connecting the Clustered Index Scan to the Hash Match (Partial Aggregate):

Instead of the per-thread row counts we saw in Test 1, we see a single count for All threads. This is exactly what we see when a serial plan is executed.
The XML show plan information contains:


The degree of parallelism is shown as zero, again exactly as for a serial plan. The individual iterator information still shows Parallel=”true”, but the run time information shows a single thread of execution.
We can go further and monitor DMVs like sys.dm_os_tasks, but suffice it to say that the parallel plan shown does indeed execute on a single thread.
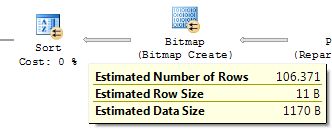
Another important difference can be seen by examining the tool-tips shown when hovering over the other connecting lines in the actual execution plan: All the connectors originating from a parallelism-specific iterator show only estimated information. As a reminder, the parallelism-specific iterators are the two Repartition Streams, the Gather Streams, and Bitmap iterators.
For comparison with Test 1, here is the tool-tip shown for the connector following the Bitmap, as before. Notice that the Actual Number of Rows information is missing.

The output from the plan information procedure is:

There is still just a single cached compiled plan and a single execution context, but the usage counts for both have increased from 1 to 2.
This shows that SQL Server was able to reuse the parallel compiled plan, but execute it on a single thread.
Running a Parallel Compiled Plan Serially
SQL Server can derive a serial execution context from a parallel compiled plan at runtime. It does this by removing the parallel-plan-specific operators. This results in a serial execution context with the same plan shape as the parallel compiled plan. This explains why the actual execution plan shown in SSMS lacks runtime information for the parallel operators—they were not present in the execution context.
SQL Server can do this because it is always possible to convert a parallel compiled plan to serial form—though the resulting serial plan may not be the optimal serial plan. The reverse is not true, however: A serial compiled plan cannot have parallel operators dynamically inserted to produce a parallel execution context.
Test 3 – After Changing a SET Option
This test changes the connection SET option NUMERIC_ROUNDABORT to ON, before running the test procedure.
The idea here is that SQL Server will be unable to reuse the cached plan (see Query Tuning Recommendations in the documentation).
In fact, we receive a serial plan, with a very different shape from the parallel version seen before:

The output from the plan information procedure confirms that a new serial compiled plan was cached, and a new execution context was created:

The point here is to show that the optimal serial plan is very different from the optimal parallel plan.
If SQL Server really had cached two optimized plans (one serial, one parallel) for our query, we would expect Test 2 to use the optimal serial plan, rather than a derivation of the parallel one.
Clean-Up
-- =================
-- Clean up
-- =================

EXECUTE sys.sp_configure
    @configname = 'affinity mask',
    @configvalue = 0;

EXECUTE sys.sp_configure
    @configname = 'cost threshold for parallelism',
    @configvalue = 5;

RECONFIGURE;
GO
DROP PROCEDURE
    dbo.TestQuery,
    dbo.ShowPlanInfo;
GO
You may need to modify the values shown if you had previously changed your server settings from the defaults.
Issues with SQL Server 2005
The ability to dynamically change the affinity mask setting was introduced in SQL Server 2005. As is sometimes the case with new features, engine support was not quite perfect first time around. If you run the test script on SQL Server 2005 you will probably not see the illustrated results.
The problem is that the engine does not quite handle things correctly for the first execution of a cached compiled plan after the affinity mask option is changed.
For example, the execution of Test 2 (with affinity mask changed to 1) will result in a multiple threads running on a single scheduler (logical CPU).
The second, and subsequent, executions after changing the affinity mask will run correctly and as shown above (a single thread using a parallel plan).
The workaround is to disregard the results from the first execution of the TestQuery stored procedure after any change to the affinity mask setting (or more precisely the required call to RECONFIGURE). All rather unfortunate, but there we are.
The second limitation with SQL Server 2005 comes with Test 3. Although a new compiled plan is generated and cached, you will not see the serial plan shown.
The optimizer produces a parallel compiled plan, despite the setting of the affinity mask. The parallel plan is nevertheless executed serially if affinity mask remains set to limit execution to a single logical CPU.
The behaviour of the optimizer changed between 2005 and 2008 in this respect—opinions may vary on which is the better approach.
Summary
- The result of a single query compilation is a single compiled plan, either serial or parallel.
- The execution engine can dynamically derive a serial execution context from a parallel cached compiled plan by removing exchanges.
Acknowledgements
Thanks to Adam Machanic and Gail Shaw for their assistance. Any errors that remain in this article are entirely my own.
