Inside the Optimizer: Plan Costing

The SQL Server query optimizer generates a number of physical plan alternatives from a logical requirement expressed in T-SQL. If full cost-based optimization is required, a cost is assigned to each iterator in each alternative plan and the plan with the lowest overall cost is selected for execution.
Costing Details
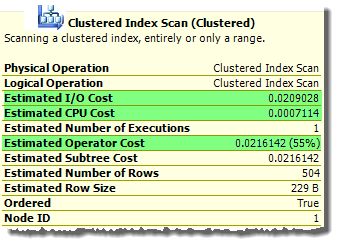
Graphical execution plans show the total estimated cost of each iterator, and the I/O and CPU cost components:

In the simplest cases (like that shown above) the total estimated cost of an iterator is a simple sum of the I/O and CPU components. In other circumstances, the final cost may be modified by other considerations—perhaps as a result of a row goal.
The I/O and CPU costs are calculated based on cardinality estimates, data sizes, statistical information, and the type of iterator.
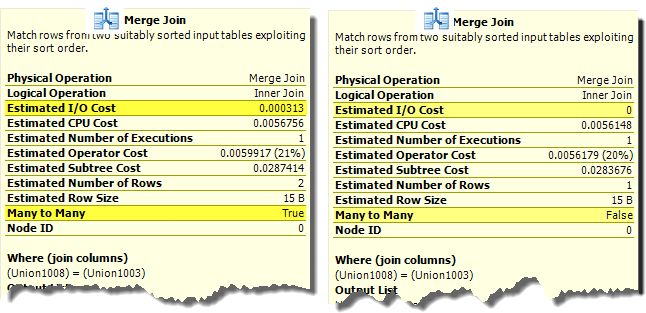
Iterators may also be costed differently depending on context. For example, a Merge Join iterator has a zero estimated I/O cost when performing a one-to-many join. When running in many-to-many mode, a worktable in tempdb is required, and an associated I/O cost appears:

The cost values represent expected execution times (in seconds) on a particular hardware configuration. The interested reader can find an in-depth look at some of the ‘magic numbers’ used by the costing component in an excellent article by Joe Chang.
It is important not to take the costing numbers literally. They are obtained from a mathematical model used to compare candidate plan fragments in a consistent fashion. It is a practical certainty that your server has very different performance characteristics from those assumed by the model. The great thing is that it does not typically matter, since it is relative plan cost that drives the final plan choice.
Although very detailed, the costing model does make a number of simplifying assumptions to prioritise speed and consistency over a more accurate reflection of reality. One good example of this is that costing assumes that all query executions start with a cold cache.
Why Use a Cost-Based Model?
Consider the task of choosing between possible physical join implementations. Many people are aware that Nested Loops is a good choice where both inputs are relatively small, Merge works well on suitably-ordered medium to large inputs, and Hash join is particularly suited to very large joins, particularly in a parallel execution plan.
One optimization approach is to code a detailed set of rules based on that sort of reasoning. This is known as rule-based optimization, and has featured in a number of database products over the years.
Experience has shown, however, that rule-based schemes lack flexibility and extensibility. Introducing a new iterator or database feature, for example, might require a large number of new rules, and many very specific changes to existing ones.
An alternative approach is cost-based optimization, based on a common, relatively abstract framework. Adding a new iterator becomes as easy as implementing the required interfaces to the existing model, reusing features which provide base cost information (such as the cost to retrieve a page from disk) and contextual data (like cardinality estimation and average row size).
Using this more object-oriented approach, relatively simple costing rules can model complex behaviours. For example, Nested Loops can be modelled with no start-up cost, and a relatively high cost per row. Hash join can be given a significant start-up cost (to build its hash table) but a lower cost per row after that.
In each case, the exact cost may further depend on row size and distribution information — the key point is that the cost is context-sensitive and dynamic.
Costing Example
Let’s look at a query written to return the quantity of products in stock at the AdventureWorks warehouse, which have names starting with the first five letters of the alphabet:
SELECT
    p.Name,
    total_qty = SUM(inv.Quantity)
FROM Production.Product AS p
    WITH (INDEX(AK_Product_Name))
JOIN Production.ProductInventory AS inv
    ON inv.ProductID = p.ProductID
WHERE
    p.Name LIKE '[A-E]%'
GROUP BY
    p.Name;
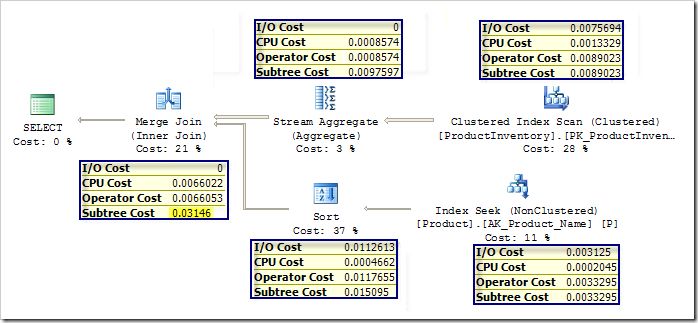
We get the following plan, where SQL Server has chosen to compute SUM(Quantity) for all products, and merge-join those results with the products that have names starting A-E (I used an index hint just to maximize the chance you get the same plan I did):

I have deliberately chosen to feature a plan where each iterator’s total cost (Operator Cost) is close to being a simple sum of the I/O and CPU cost components. Just the Sort and Merge Join iterators add a small amount for overheads: the Sort adds 0.000038, and the Merge Join adds 0.0000031.
One final thing to notice is that each iterator knows the cumulative cost of all iterators below it (the ‘subtree cost’).
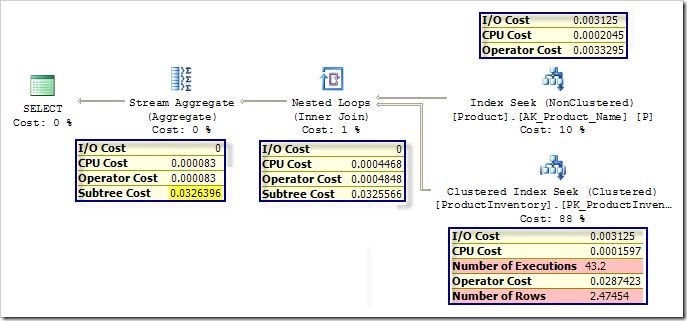
Let’s now force a nested loops join plan with the same query, and compare the costs:

Looking at the highlighted top-level subtree cost, we can see that this plan is very slightly more expensive than the Merge equivalent overall, which explains the optimizer’s choice. We can also see that the Stream Aggregate and Nonclustered Index Seek have Operator Costs equal to the sum of their I/O and CPU costs. The Nested Loops iterator adds a small overhead of 0.000038 to its stated CPU cost. The costing of the Clustered Index Seek is somewhat more complex…
Costing the Clustered Index Seek
The CPU cost is calculated as 0.0001581 for the first row, and 0.000011 for subsequent rows.
In this case, SQL Server expects each execution of the Clustered Index Seek to produce 2.47454 rows, so the CPU cost is 0.0001581 (for the first row) plus 1.47454 * 0.000011 (for the remainder). This calculation produces exactly the 0.0001597 CPU cost seen in the plan.
The final CPU cost contribution is obtained by multiplying this per-execution CPU cost by the expected number of executions. SQL Server expects the Index Seek on the Product table to produce 43.2 rows, so the final CPU cost of the Clustered Index Seek is 43.2 * 0.0001597, which comes to 0.00689904.
The I/O cost of 0.003125 is exactly 1/320 – reflecting the model’s assumption that the disk subsystem can perform 320 random I/O operations per second (each fetching a single 8KB page).
Again, this estimate needs to be modified to account for the expected 43.2 executions. However, the costing component is smart enough to recognise that the total number of pages that need to be brought in from disk can never exceed the number of pages required to store the whole table.
The Product Inventory table uses only 7 pages, so the modelled total I/O cost is approximately 7 * 0.003125, which comes to 0.021875.
Adding the CPU and I/O subtotals, we get a total operator cost of 0.02877404. This is not quite the 0.00287423 cost shown in the plan because I have simplified the calculation slightly to more clearly illustrate the process.
Undocumented Features
So far, we’ve seen how the I/O and CPU costs contribute to plan selection. In this last section, I want to show you a couple of undocumented features which allow you to change the I/O and CPU cost calculations. As usual, this is presented for entertainment and educational reasons only.
Never use these tools on anything other than a personal test system.
There are two undocumented DBCC commands, SETCPUWEIGHT and SETIOWEIGHT, which apply a multiplier to the cost values normally produced by the costing component. By default, both are set to 1, which produces the unmodified I/O and CPU costs you normally see.
Each command takes a single parameter of the real floating-point type. The easiest way to enter a literal floating-point value is to express it in scientific notation.
A third undocumented DBCC command, SHOWWEIGHTS, can be used to display the effective settings for the current session. As usual, we also need to enable trace flag 3604 to see the output from these DBCC commands (which appears in the SSMS messages window).
Let’s say we want to see the effect of making I/Os cheaper. We can adjust the base I/O costing to 60% of its default value by executing this command:
DBCC TRACEON (3604);     -- Show DBCC output
DBCC SETCPUWEIGHT(1E0);  -- Default CPU weight
DBCC SETIOWEIGHT(0.6E0); -- I/O multiplier = 0.6
DBCC SHOWWEIGHTS;        -- Show the settings
If we now run the query used in the costing example, we find that the optimizer now chooses the Nested Loops plan, because it now has a lower overall cost than the Merge Join plan. We can achieve the same effect by raising the CPU weight to 1.7, while resetting the I/O cost multiplier to 1.
We can produce a plan based on a Hash Join by lowering the CPU cost multiplier below 0.8, or raising the I/O cost multiplier to 1.3:

There is a great deal to be learned about the workings of the costing component and the optimizer as a whole, by playing around with these settings. One particularly interesting combination is to set both cost multipliers to zero. This can cause the optimizer to reveal some of its internal workings, as in the following example:
SELECT
    ps.Name,
    cnt = COUNT_BIG(*)
FROM Production.ProductSubcategory AS ps
JOIN Production.Product AS p
    ON p.ProductSubcategoryID = ps.ProductSubcategoryID
WHERE
    EXISTS
    (
        SELECT
            SQRT(PI())
        FROM Production.ProductInventory AS inv
        WHERE
            inv.ProductID = p.ProductID
            AND inv.Shelf = N'A'
    )
GROUP BY
    ps.Name;
With both multipliers set to zero, the optimizer produces a plan containing three consecutive sorts:

Notice that all three sort in the same way, and all operator costs are zero. The extra sorts are the result of the application of enforcer rules, and are normally removed from the final plan since they are redundant. Setting the costing multipliers to zero removes the advantage in doing this.
Have fun but don’t forget to reset everything to the default when you have finished experimenting. Thanks for reading.
